Service Providers in the Trophic Theory of Money
by Brian Czech
Steady State Herald readers are familiar with the theory that money originates from an agricultural surplus that frees hands for the division of labor—and thenceforth the exchanging of money. This trophic theory of money (TTOM) helps us understand not only the historical origins of money, such as in Mesopotamia (the “Cradle of Cash”), but also the annual origins of “warranted money” in the grain belts of the world.

All else equal, lots of agricultural surplus—allowing for a substantial division of labor—warrants a large money supply. Conversely, money is unwarranted if everyone is busy with mere subsistence. Under the most severe subsistence regime, there is nothing to exchange and no time for exchanging. Unless you receive rare pleasure from non-stop subsistence, it’s the classic Hobbesian life: “poor, nasty, brutish, and short.”
And cashless, as money is meaningless with nothing to exchange.
The concept of warranted money should make economists and policy makers think twice about “the fundamentals” of the economy. With a basic understanding of trophic ecology in politics, a fitting campaign slogan would be, “If it’s the economy, don’t sell the farm!”
Energy and Services: Technically Immaterial
To date, however, we have glossed over two key issues in the development of the TTOM: energy and services. (A notable exception was Alix Underwood’s recent contribution, revisited briefly below.) Glossing over energy and services in presenting the TTOM is no coincidence, because in and of themselves, energy and services are non-material aspects of economic production. Trophic levels, on the other hand, tend to bring our attention straight to the matter (so to speak) of material production.
Recall that the TTOM builds upon the ecological concept of trophic levels in the economy of nature with its non-human species. Plants, algae, and phytoplankton comprise essentially the entire bottom trophic level of life on Earth. They are, in other words, the foundation of the economy of nature. The second trophic level consists of the primary consumers or herbivores that eat plants, converting plant material into animal flesh. The third level is secondary consumers that convert herbivore flesh into carnivore flesh. Think, for example, of grass nourishing elk and elk nourishing mountain lions —a food chain from the trophic base

Trophic ecology in action: bull elk converting plant biomass to animal biomass (Oregon Department of Fish and Wildlife, Flickr)
through secondary consumption.
While our attention is on the production of biomass, the flow of energy is right behind the scenes. The very definition of “trophic” is “relating to feeding and nutrition.” Animals feed to obtain energy and nutrients for purposes of bodily development, maintenance, and reproduction.
Herbivore biomass is produced with the energy flowing from plant material in the process of digestion. Similarly, carnivore biomass is produced with the energy converted from herbivore flesh. In other words, there is a tight, integral linkage between energy flow and biomass. In fact, the complete collection of trophic levels is sometimes called an “energy pyramid.”
Let’s take a closer look at the role of energy in the economy of nature, then consider the implications for the human economy, with its rich collection of service sectors, industries, and occupations. After all, we are told to distinguish services from goods based on their intangibility; that is, their non-material nature. The intangibility of services strongly suggests that energy flows must be especially relevant to the value of services.
Farming with Fossil Fuels, Fertilizers, and (Especially) Photosynthesis
While animal biomass is produced via digestion, how does the trophic process get rolling to start with? In other words, what do the plants at the trophic base “eat” and how do they “digest” it? What parallels does this process have with agricultural production in the human economy?
What gets the ball rolling is the process of photosynthesis. Given solar energy, water, and nutrients from the soil—along with the chlorophyll that makes them green—plants can grow and reproduce. Chlorophyll allows them to literally synthesize biomass with photons of light from the sun. That’s photosynthesis in a nutshell.
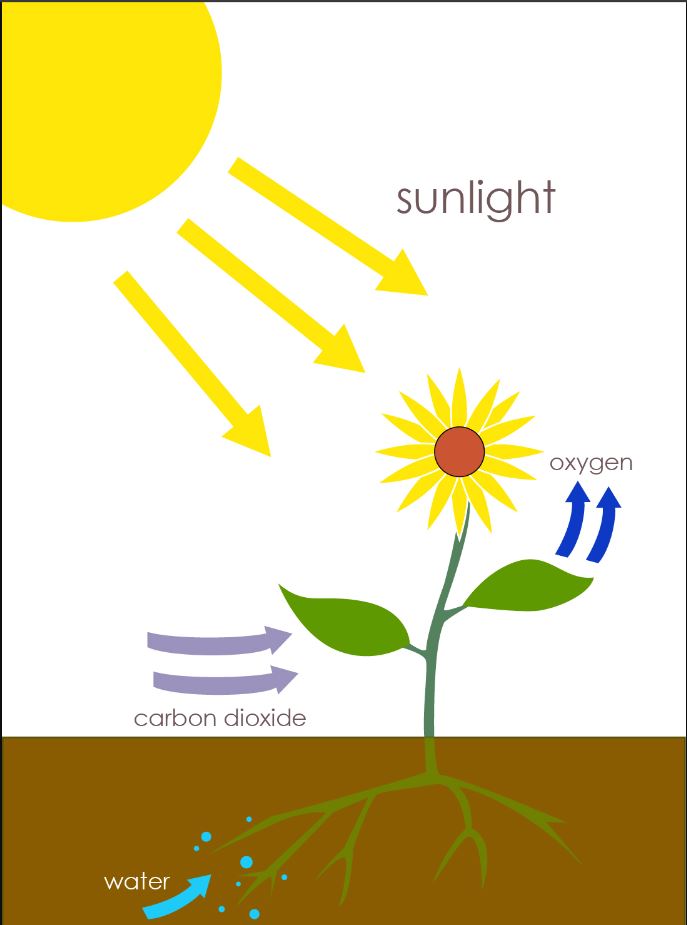
Photosynthesis: 6CO2 + 6H2O → C6H12O6 + 6O2. Can’t leave home without it (At09kg, Wikimedia).
It’s hard to think of a more profound phenomenon than photosynthesis, at least if our primary concern is life on Earth. It’s a process that evolved roughly three billion years ago, and remains “the only significant solar energy storage process on Earth” as well as “the source of all of our food.” That puts it squarely at the trophic base!
By no means is photosynthesis skipped in the human economy, either. Farmers work with the process of photosynthesis all the way from germination to harvest. The remarkable productivity gains of industrial-age farmers has resulted from power-train technology fueled by petroleum products, as Underwood pointed out, plus fertilizers requiring copious quantities of natural gas. Yet there would be no tractors, oil rigs, or fertilizer plants in the absence of photosynthesis, the trophic starting point for the feeding of labor, management, capitalists, and indeed all of Homo sapiens.
The point here is that the trophic structure of nature is no mere metaphor for the human economy. It’s not even just an analogy. Homo sapiens is at once an omnivorous species in the economy of nature and a collaborator with plants at the trophic base of the human economy. Photosynthesis is a service provided by plants, while cultivation is a service provided by farmers. The combination of these services leads to the production of highly material, edible, nutritious plant biomass: that is, food.
This brings us to a consideration of services in the trophic structures of the economy of nature and the human economy.
Service Providers Are Trophic Actors
In the economy of nature, many species provide services that are beneficial to others. Some might even say that all species, simply by living, provide the “service” of nutrient provision to any species that consume them. But that’s playing loose with semantics, no? After all, the relevant product for the consumer is the tangible, edible flesh of the plant or the prey or the carcass. Food is a “good” in the economy of nature, not a service.
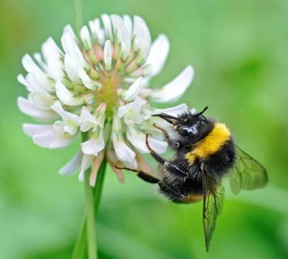
Sipping nectar and pollinating clover. What came first: consuming food or providing a service? (christels, Pixnio)
Yet certain species are well-known for providing “ecosystem services,” or activities that benefit others in less material ways. Trees provide shade. Bees and butterflies pollinate plants. Nature has some real “janitors” too, like dung beetles, worms, and fungi.
As best we can tell, none of these species sets out with the intention of providing services. A honey bee doesn’t motivate itself by thinking, “Today I’ll go pollinate some apple flowers for future generations of apple-loving aphids, apple-loving bears, apple-loving humans, etc.” Rather, ecosystem services are provided incidentally. The fact that a species is a service provider per se doesn’t preclude it from comprising food for other species, either.
In other words, every species—even the service providers—occupies a level in the trophic structure of the economy of nature. Honey bees turn out to be omnivores that eat not only nectar and pollen, but also microbes, bee larvae and surely other occasional animal materials.
Some ecologists have incorporated detailed methods for quantifying the trophic levels, or “trophic score,” of species. They’ve taken into account the variety of plant and animal species consumed by each species. At the trophic base, plants score a solid 1.0 (presumably with the rare exception of carnivorous plants like the Venus fly trap). Animal trophic levels typically range from 2.0 (Holstein cow, for example) to 5.5 (polar bears, sharks). Omnivores have middling scores. The global mean human trophic level is roughly 2.2.
Still other ecologists have endeavored to score guilds of species—typically aquatic ones—based on average or weighted average of trophic levels held by occupants. There is even a “trophic state index” for providing management implications for lakes.
Service Provision in the Human Economy
One of the species that benefits from service providers in the economy of nature is Homo sapiens. Pollination, soil formation and maintenance, and carbon sequestration are some of the most valuable services provided by non-human species.
As a participant in the economy of nature, and especially in the human economy, Homo sapiens provides numerous ecosystem services, too. Bumble bees don’t have a monopoly over pollination, for example. Definitely not in China, where human pollination of pear trees is picking up because pesticides have decimated bee populations.
Ecosystem services are often categorized as supporting, provisioning, regulating, or cultural. As with the “nutrient provision” noted above, the identification of provisioning services might seem like a ploy, because the provisions in question (food, water, fiber, etc.) are clearly tangible. Yet including this category helps us to recognize that the separation between goods and services is by no means absolute. At a minimum, goods require transportation services to make it to the market. Many goods also entail services merely for the act of consumption; food services, for example.

For a Taylor Swift concert, which commits the greater ecological footprint, production or consumption? (Michael Hicks, Wikimedia)
On the other side of the coin, no services operate independently of goods. If we were to come up with the closest thing to an entirely “good-less” service, we might think for instance of entertainment. Yet the most popular forms of entertainment rely heavily on things like costumes, equipment, props, and venues. In fact, some of the highest ecological footprints of all activities occur in the process of entertainment: NASCAR for example.
Even the act of consuming entertainment can be a highly tangible matter. When Taylor Swift swept into Stockholm, 178,679 fans showed up to see her. They were not angels, dancing on the head of a pin. Each was a living, breathing, eating, dressing, traveling specimen of Homo sapiens. They consumed all the way to the concert and back.
The ubiquitous linkage of goods and services prompts me to coin a term. While we could simply continue to speak of goods and services, “gervices” would remind us with each utterance that goods and services are linked at the hip. It would remind us, in other words, that notions of “decoupling” GDP from environmental impact were about as solid as pipe smoke.
Trophic Levels of “Gervices”
For purposes of developing a more rigorous TTOM, it would be beneficial to calculate or at least estimate the trophic levels of economic sectors or occupations. We would likely start with the 20 broad sectors identified in the North America Industry Classification System. Some of them are clearly agricultural and extractive sectors, some are manufacturing, and many are service sectors, in conventional terms.
Materials and energy, goods and services, are at constant interplay in the trophically integrated economy.
We would score the agricultural and extractive sectors at 1. Manufacturing scores would range from 2 through, say, 5.5 (a somewhat arbitrary number except in mirroring the system used by ecologists). It is quite conceivable, for example, that lumber production would score roughly 2—maybe up to 2.3 for finished, treated lumber. It is just as conceivable that computer chips and nanobots would vie for the highest score of 5.5.
Averaged across the economy, these trophic scores would reflect the division of labor. Higher scores indicate more agricultural surplus at the base. For example, if the mean trophic score was 1.0, the economy would be mired at a subsistence level. Pursuant to the TTOM, then, an expansionary monetary policy would be futile. If the mean trophic score was 2.75, clearly the economy would have undergone a tremendous degree of trophic development, enabled by copious agricultural surplus.
A lasting trend in mean trophic score would be an indicator, all else equal, of economic capacity. If the trophic score increases for decades—as it surely did (albeit unmeasured) in the United States through most of the 20th century—the nation hasn’t reached the limits to growth. Once it starts declining persistently, it is a warning sign that limits have been breached.
We can readily hypothesize that a declining trophic score would be associated with environmental deterioration, a burgeoning list of threatened and endangered species, lower real GDP (that is, recession), stagnant or declining total factor productivity, and cost-push inflation. The exception would be with intentional degrowth and/or intentional lowering of mean trophic level; an unlikely but not impossible scenario.
Micro or meta-examples (that is, specific to certain sectors or industries) already exist. For example, many citizens have opted to “eat lower on the food chain.” Lessening their environmental impact is typically one of the motives. The trophic theory of money implies that, in general, consuming lower in the trophic levels entails less environmental impact—less of an ecological footprint—and is therefore more sustainable.
A finishing touch would be to equate trophic scores with prices. Grain is cheap; computer chips are not. Value is added as we move up in trophic level. But of course many other variables go into pricing. Diamonds and water are each extracted at the trophic base, but there’s no need to get wrapped around that axle just yet. What we hope to tackle first is how to calculate the trophic scores of those gervices that are typically classified as “services” per se. Stay tuned, please. Biophysical economists are welcome to collaborate, too.
For now, the bottom line is that the TTOM will continue to serve as a durable reminder of the primacy of agricultural and extractive activity in economic production. It belies the notion of decoupling GDP from energy and material use. It reminds us, in other words, of the fundamental conflict between economic growth and environmental protection. That alone makes it worth the time to test, develop, and apply.
Brian Czech is CASSE’s Executive Director


Thanks, Brian. This is extremely helpful in understanding why so-called decoupling economic growth from biophysical resources is an OXYMORON.
Good article, and by the way it is itself (like you and me) another one of the many byproducts of photosynthesis. Made me think: What unfolds when climate change strongly reduces photosynthesis around the world? In the meantime I’m harvesting carrots today in my veggie garden thanks to photosynthesis.
Very intriguing … I especially like the potential use of a mean trophic score as a sort of canary in the coal mine, indicating that limits are being met. Lord knows the US and humanity in general could use such an indicator.
I’m pretty sure that national policy people and politicians (with whom I don’t interact) are similar psychologically to executives in large and complex companies (which whom I *do* interact). Which means, alas, there’s no appetite for deep reading. But, there is appreciation for summary metrics that warn of trouble. MTS (Mean Trophic Score) might do the trick. Calculating MTS consistently over time might be a major task – if I have an epiphany about that I’ll be sure to share.
Cole, you are right on the money (so to speak and in more ways than one).
I had a lengthy conversation yesterday with a respected CASSE advisor, who called to express a concern that I’d be getting too low into unproductive weeds if I spent much time pursuing MTS methodology. I had to agree, because there just are too few steady-state organizations. We don’t have the luxury of lengthy, deep dives into academic pursuits.
My focus has to be more on organizational development and policy advancement. That’s one of the reasons I put out the collaboration welcome mat to biophysical economists. The TTOM is starting to generate interest with them, so hopefully a major academic institution will take it up.
We also have a great Research Associate, Alix Underwood, although her time too is spread thin. Staff at a small non-profit end up having to assist with all manner of administrative and technical tasks.
In the non-profit world of advancing the steady state economy, prioritization is non-stop.
Good effort. I have also consistently argued that “services” can’t be separated from the production of goods. As a matter of fact MOST services are directly linked to this production. You mention transport, but there are also numerous other services that are essential in industrial production. The trend of outsourcing also meant that many things that earlier was made by people employed by the factories now are classified as services.