Using GDP to Estimate the Limits to Growth
by Brian Czech
The merits and proper uses of GDP—gross domestic product—have been debated with increasing frequency and intensity in recent years. Neoclassical economists continue to view a growing GDP as the sign of economic success and even social health. Conversely, ecologists who have studied the issue view a growing GDP as an alarming indicator of unsustainability at this point in history.
Meanwhile, a growing number of individuals and organizations in the post-growth community have proposed to eliminate GDP altogether, to just “get rid of it.” They argue, typically from a progressive political spirit, that a focus on GDP causes policy makers to think too much in economic terms rather than in terms of environmental, social, and general wellbeing. Some even claim that GDP is a “meaningless” indicator, with no utility for the measurement of anything important.
Cute image, but don’t mistake GDP with “transaction volume,” much less on credit. GDP is the macroeconomic flow of real production and real money. (Blue Diamond)
I and CASSE are firmly in the ecologist’s camp. We’ve elaborated for decades upon the fundamental conflict between economic growth—as measured with GDP—and biodiversity conservation. Then, with the trophic theory of money, we’ve provided a theoretical foundation for recognizing GDP as an excellent indicator of environmental impact at large.
Herein I will supplement the trophic theory of money with empirical evidence that GDP is not only “an indicator” of environmental impact, but even a measure that may be used to estimate how close we are to the limits to growth.
Trophic Theory of Money in a Nutshell
Money originates via the agricultural and extractive surplus that frees the hands for the division of labor into non-agricultural, non-extractive activity. If there is no such surplus, everyone is busy producing, gathering, or in desperate cases commandeering “food, clothing, and shelter,” not just proverbially but literally and existentially. Money is meaningless and moot.
Conversely, with plenty of agricultural and extractive surplus at the base (the “trophic” base in ecological terms), the division of labor may proceed all the way to the expansive array of manufacturing and services sectors we find today. The hands freed from the soil are finally free to exchange money, too, for the goods and services produced. It makes sense, at that stage, to have a readily transportable, widely accepted, durable means of exchange, unit of account, and store of value. Money, in other words. In fact, given the proliferation of goods and services, it makes little sense not to use money, because of how much more efficient it is to exchange money than it is to barter goods and services (or, for Graeber fans, to erase a debt with barter).
The trophic reality is that money originates at the agricultural/extractive base of the economy, where surplus allows for the division of labor (and the exchanging of money).
That’s the trophic theory of money in a nutshell. It starts with the trophic structure of the economy and proceeds with the recognition that the monetary sector exists only because of the real sector, and only with surplus at the trophic base of the real sector. That is, money arises for the efficient exchange of tangible goods and services (all of which are performed with tangible labor and equipment). The more fully developed the trophic structure becomes—by adding highly diverse manufacturing and service sectors—the greater the role money plays in accounting and in storing value.
Conversely, if the real economy collapses—due to environmental catastrophe, for example—then whatever money supply exists becomes essentially worthless. At best, it is hyperinflated. Who wouldn’t pay a bushel of money for a loaf of bread, with starvation at the door?
Origins of Money: Ultimate and Proximate
The trophic origins of money may be described in historical, archeological terms, such as the evolution of the shekel in the world’s first grain belt of Mesopotamia. Describing the evolution of money in these historic, first-instance terms identifies what we might call the “ultimate” origins of money. These origins remain forever relevant. As Aristotle pointed out, “He who thus considers things in their first growth and origin, whether a state or anything else, will obtain the clearest view of them.”
On the other hand, the origins of money hardly stop with the first instance. To think they do would be like saying, “Once Homo sapiens evolved, no more humans originated.” In fact, long after Homo sapiens originated in the ultimate, evolutionary sense, humans continue to originate every day. The species had to evolve (originate evolutionarily) before each new human could be born (originate biologically).
Evolutionary ecologists even like to argue that “ontogeny recapitulates phylogeny,” meaning that the development of a fetus in the womb profoundly reflects the evolution of the species. Without such abstruse jargon, and with greater certainty, we can say that “annual grain surplus recapitulates the Neolithic transition,” especially in the sense of money originating therefrom. Money evolved in the long development of agriculture; it “originated” that way. Ever since then, money has originated each and every year—another year of GDP—as an annual pulse of agricultural surplus flowed from the world’s breadbaskets. This pulse of surplus grain (plus other staples such as legumes and potatoes) is what ultimately authorizes the monetary “authorities” such as the Federal Reserve and the European Central Bank to issue additional stocks and flows of money.
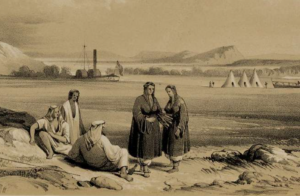
Euphrates River Valley: origins of agricultural surplus — and money. (Picryl)
This is not to say the economists at the Fed realize they’re being authorized to issue money by farmers working with Mother Nature, Divine Providence, or Gaia (pick your teleology), and that is precisely one of the major economic problems of today. Neither monetary nor fiscal economists of neoclassical training have a solid grasp of the ecological principles underpinning the human economy. That is why a need was perceived for an “ecological economics.” Unfortunately, the ecological economics movement has largely underperformed, and remains confined to tight quarters in academia. The underperformance stems from the fact that a very low percentage of the economists populating ecological economics actually have much ecological background.
Conversely and similarly, only a meager share of bona fide ecologists have taken to economics to any significant degree. Among those who have, some have been disgruntled with what they’ve encountered. Dissatisfaction with ecological economics has even caused some ecologists to abandon organizations such as the U.S. Society for Ecological Economics and organize instead under other banners such as “biophysical economics.”
There’s a purpose for noting these academic stovepipes. It helps to explain how, even in “ecological” economics circles, many individuals still fail to realize the tight, fundamental linkages among GDP (the macroeconomic flow of money), agricultural/extractive surplus, and environmental impact.
GDP, Ecological Footprint, and Trophic Causality
The ecological footprint concept is further along in its development than the trophic theory of money, with at least one organization, the Global Footprint Network (GFN), devoted exclusively to the refinement of the concept, measurement of the metric, and advancement of policy implications. The concept is quite straightforward, although the definitions of “ecological footprint” and related terms have become more nuanced over the years. To put it simply, though, the ecological footprint is the area needed to support the activities of people. It’s a way of expressing the human demand on nature.
Earth’s area is roughly 510 million square kilometers (51 billion hectares). The GFN estimates that 12.2 billion of these 51 billion hectares are “biologically productive land and water.” The 12.2 billion hectares are therefore useful for stocking human economies with flows of ecosystem goods and services.
While all hectares are precisely the same size, no two provide precisely the same resources. A hectare in the corn belt of Iowa, for example, has far higher biological productivity than a hectare in the shortgrass plains of eastern Wyoming. Furthermore, biological productivity changes constantly with climate and geological forces. So, the GFN uses a concept called the “global hectare,” which is simply “a biologically productive hectare with world average biological productivity for a given year.” By definition, then, there remain (roughly) 12.2 billion biologically productive global hectares at this point in history, but “local hectares” in ecological footprint accounting don’t equate precisely to hectares per se. There’s a lot more global hectares packed into a square kilometer of prime Iowa farmland than in a square kilometer of shortgrass Wyoming ranchland.
Yet there is no need to get wrapped around the axle of global vs. local hectares. From here on in, we can continue in the vein of economic activity requiring space, and especially (or ultimately) the biologically productive space at the trophic base. We know that, in today’s globalized economy, the hectares depended upon by most major cities and nations are scattered across the globe. The USA, for example, rich as it is in resources, still requires vast areas around the world for its full demand of food, fiber, mineral and energy resources.
The ecological footprint, then, is a powerful concept for assessing the sustainability of local, national, and global economies. It’s simply not sustainable if more hectares are needed to support the economy than the hectarage available. When that occurs, we are in a state of overshoot. According to the GFN, we’ve been in global overshoot since the 1970s, in large part due to the excessive consumption demands of the USA and other large, wealthy nations.
Being in a state of overshoot means we are operating on borrowed time. We can do this only in the short term by liquidating stocks of natural capital such as timber, fisheries, and forage. We’re using more biocapacity than what can be regenerated over time. Think clearcutting, overfishing, and overgrazing. The ecological footprint is too heavy for the Earth to abide. We party now; posterity will pay.
Meanwhile, pursuant to the trophic theory of money, there must be a tight linkage between the ecological footprint and GDP. In fact, the first corollary of the trophic theory is that “the quantity of money—and GDP—indicates the amount of agricultural surplus and related activity at the trophic base of the economy (i.e., mining, logging, commercial fishing and other extractive activity) and the environmental impact of such activity.”
One way to measure such activity and impact is with the ecological footprint, and we find it tightly correlated indeed with GDP. At the global level (where all trade is balanced out), the ecological footprint tracks close to perfectly and super-significantly with GDP.[1]

Practically speaking, GDP is the ecological footprint. (Footprint from Free SVG; GDP from CASSE)
Of course, we must acknowledge that “correlation does not imply causation” (although it can, in some cases). That said, testing a causality hypothesis often starts with testing for correlation. If the growth of one variable causes the growth of the other, then the two variables are going to be correlated. You might view such correlation as a sort of statistical “circumstantial evidence,” leaving the jury more inclined to find the “defendant” guilty.
Meanwhile, the trophic theory of money is essentially a causality hypothesis, pursuant to which the growth of GDP requires an expanding ecological footprint. If the hypothesis is sound, then GDP and the ecological footprint will be correlated, and they most strongly are.
Without an ecological hypothesis of causality, such as the trophic theory of money, how else would we account for the tight correlation between GDP and the ecological footprint? We’d be tempted to pass it off as an incidental, accidental, or spurious correlation. This probably explains why so many “ecological” economists (lacking ecological bona fides) have expressed confusion about whether or not GDP can be delinked or decoupled from environmental deterioration such as biodiversity loss, declining natural capital stocks, and pollution at large.
Ironically, ecological economics (as well as the degrowth movement) could become a Trojan horse for neoclassical, perpetual growth theory if its practitioners fail to study, accept, and explicate the linkage between GDP and the ecological footprint. After all, if we refuse to acknowledge the linkage, and reject a sound causal hypothesis to explain that linkage, how different are we from the neoclassical growth economists who do precisely the same?
Using GDP to Estimate the Limits to Economic Growth
The next step in quantifying the relationship between GDP and ecological footprint is a regression analysis. Our regression model indicates that, at the global level (where trade is balanced out), the ecological footprint increases by 0.53 percent for each percent increase in GDP.[2] So, for example, if GDP grows from $100 trillion to $101 trillion, the ecological footprint grows from 23.8 billion to 23.9 billion hectares.
At this point, with super-significant correlation, a sound causality hypothesis, and a meaningful regression equation, we can use GDP as a surrogate for the ecological footprint. Why use a surrogate, rather than the ecological footprint itself? We have at least two good reasons.
First, we need to put limits to growth in terms that are readily understood by fiscal and monetary policy makers, including Congress and the Fed, respectively. Apprised of the tight, causal linkage between GDP and the ecological footprint, as illuminated by the ecological and statistical sciences, informed policy makers will be reminded of limits to growth when they discuss GDP growth goals, budgets, and debt ceilings. Gradually, a growing GDP will become more of a warning of overshoot than welcome economic news. Some true ecological macroeconomics will seep into the body politic.
Second, the calculation of ecological footprint estimates is complicated and costly for cash-strapped governments. GDP, on the other hand, is already calculated with unrivalled rigor and consistency. Whereas few countries (if any) have truly adopted ecological footprint accounting for the long run, nearly all countries have well-established programs for national income accounting. Even for those that don’t, the World Bank estimates GDP by country.
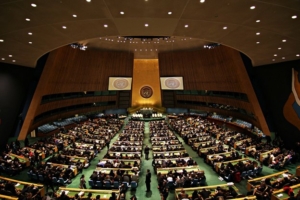
UN General Assembly. Not all nations can afford and adopt the ecological footprint methodology. All speak the language of GDP.
In other words, we essentially have an ecological footprint estimate for every nation on Earth, put in terms of GDP and convertible to the ecological footprint per se. Nations with massive GDPs have massive ecological footprints; those with small GDPs have small ecological footprints. Ecological footprint per capita may likewise be estimated with GDP per capita.
Given our ability to estimate the ecological footprint with GDP, we (including our governments, academics, the GFN, etc.) can focus more of our limited resources on the calculation of biocapacity, which is the other crucial datum in determining sustainability. If the ecological footprint exceeds biocapacity, we have breached our long-term carrying capacity and entered into the unsustainable state of overshoot. It matters not if the ecological footprint is measured directly or converted from GDP.
For example, just as the GFN estimates that global overshoot commenced in 1971, when biocapacity was 10.1 billion global hectares, we’d estimate likewise by converting the 1971 GDP into the ecological footprint. GDP then was $18.8 trillion (in 2015 dollars), which corresponds with an ecological footprint of 10.1 pursuant to the regression equation. (The ecological footprint per se, calculated by GFN, was 10.3.) In other words, whether estimating the ecological footprint directly or deriving it from GDP, we identify 1971 as the first year of being at or beyond full capacity.
Similarly, assuming a 2018 global economy of approximately $82.5 trillion (in 2015 dollars), we’d derive an ecological footprint of 22.2 billion hectares, or 184% of biocapacity. This is an overshoot figure similar to the most recent estimate of the GFN (175%).
None of this implies that we should stop refining the concept of the ecological footprint or estimating it wherever the fiscal and political resources allow. However, given the tight, causal correlation and regression equation connecting the dots from GDP to the ecological footprint, no government or politician has an excuse to delay a program of conservation if the polity in question (nation, province, state, city) is in a state of overshoot.
As we’ve emphasized at CASSE for two decades, “Sustainability is a steady state economy.” It’s time to add, “GDP is the ecological footprint.”
Footnotes
[1] R2 = .97, p < 2 × 10-16
[2] Ecological Footprint = 934 x GDP(0.53). Ecological footprint data from the Global Footprint Network’s 2022 National Footprint and Biocapacity Accounts. GDP data from the World Bank’s 2022 World Development Indicators. Time series: 1961-2018. Analyses conducted with ordinary least squares regression.
Brian Czech is CASSE’s Executive Director.


Interesting… there’s a lot to think about here, but the 3rd to last paragraph is what really caught my attention. Noting that the GDP estimate puts us at 184% of biocapacity, and how closely that maps to GFN’s estimate of 175%.
Dang. That’s too close to be mere coincidence. So GDP really does seem to be useful, after all.
Of course, the take home message is (as expected) pretty unsettling.
Yes and actually the figure is closer yet — 178% as I recall — when we use the non-rounded numbers from the regression model. (Rounding in an exponent, especially, makes quite a difference.) But we rounded for blog style and stuck with rounded math in case anyone wanted to cross-check our calculations.
There are only two resources that limit humanity and they are human creativity and energy. Given energy I can provide all other so-called resources. Remember elements like copper don’t go away, they just get more dilute and energy can concentrate them.
Nuclear energy using breeder reactors can give us a 500 year energy supply of already mined U238.
The GDP can continue to be decoupled from energy and that means decoupled from the environment. This is a trend that has been in place for a century as the energy/GDP ratio decreases. That is why the oil shock this time around had lower overall impact than in the 70’s.
That might be the case if technological progress was manna from heaven. But no, it takes a tremendous level of spending on R&D, meaning it requires even more of an ecological footprint (think trophic origins of money) just to get the new technology. That hamster wheel is why — despite neoclassical economists and technological optimists telling us for a half-century that technology will solve the problem — we continue to have a worsening ecological footprint, biodiversity collapse, global heating, etc.
You can read more about it in Chapter 7 of Supply Shock — “Technological Progress and Less-Brown Growth.”
What an excellent article. Helps also explain a bit about MMT (although I think modern banking institutions have lost sight of the underling agricultural excess).
I go back to the old analogy of Mesopotamia – as agriculture developed in the Tigris/Euphrates region, more people were fed, so more land needed to be cultivated, so irrigation ditches needed to be built to extend the growing area and soon some people had to be employed just to actually dig and maintain the irrigation system, then others needed to be employed to police and tax these irrigators, then others are needed to make the houses, extract minerals to make machinery, then to support an army to protect themselves from others who wanted their agricultural resources – and so a more and more complex society evolved. The top levels of society now being further and further removed (but still dependent on) the underlying primary productivity.
Very insightful input. Great way to illustrate trophic development, too, right from the first surplus-producing, money-authorizing breadbasket.
Without innate talent in science, I approach Brian’s articles as an eager student, by “translating” the concepts into imagery. After my second reading, I put myself on a bicycle, riding through the Iowa cornfields, and I visualize ecological footprint exceeding biocapacity. Suddenly, everything looks different. This “prime Iowa farmland” is actually a vast green-washed strip mine, extracting material for biofuels and agro-industrial animal feed. Of the 12.9 billion acres of Iowa corn farming, only 3,400 acres go to sweet corn for human consumption. I am fascinated by the mystery of how biological life originated from inorganic mineral. My personal definition of overshoot is when biological life de-evolves back to into mineral.
That’s a really good insight – “definition of overshoot is when biological life de-evolves back to into mineral.” Alas, one can almost imagine a deity watching that happen and thinking, oh well, they just couldn’t learn.
If I recall correctly, anthropologists postulated that a key evolutionary step for humans was being able to imagine different situations, and then act on them. Such as, what if our hunter-gatherer group waited on top of the big rock for the gazelle to pass by, making an easy target? What if we stuck these seeds in the ground and came back next season?
I think it’s fair to say that this ability to imagine and understand the impact of different futures is profoundly important to individual well-being. Saving money (or not), studying for an important exam (or not), avoiding sugar in one’s diet and exercising, and so on. Where we as a species fall short seems to be our ability to take action today, to prevent calamities that have a high likelihood of hitting us all in the future. There’s a little bit of this that goes on, planning for repairing infrastructure and things like that, but we don’t really seem to be able to take the collective future as seriously as our individual futures.
Maybe we’ll get better at that – I get the sense that younger generations are thinking that way more. I will hope for the best.