Hitting Freshwater Rock Bottom
by Alix Underwood and Marwa Ebrahem
Freshwater is arguably the single most essential resource for human life. Yet, its use seems more abstract than that of solid materials. Freshwater sources exist everywhere that humans do, but they are often hidden from view, buried underground or frozen in glaciers. It’s hard to fathom the scope and the impact of the 3.95 trillion cubic meters of freshwater the human economy extracted in 2021. For starters, that’s 40 times more (in tonnes) than the raw, solid material extracted the same year.

Global GDP data comes from the World Bank, and freshwater-withdrawals data comes from the UN’s Food and Agriculture Organization and was accessed via Our World in Data.
Freshwater is a renewable resource, but we’re depleting stores faster than nature replenishes them. What’s more, nature is replenishing these stores more slowly as the planet warms and weather patterns become more extreme. We’ve already crossed a “planetary boundary” for freshwater change, with too much human pressure on this resource to maintain a stable Earth system.
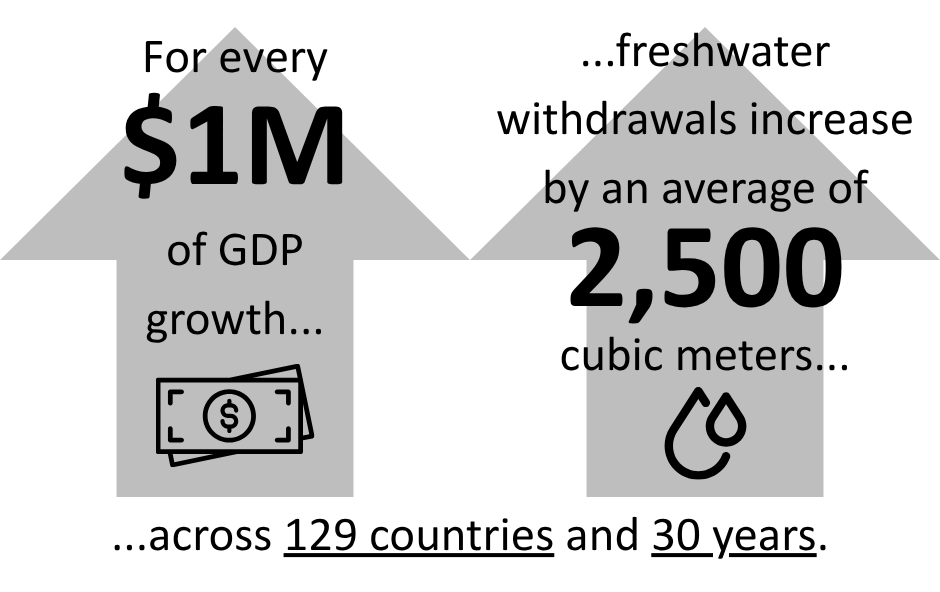
The global economy exerts this “human pressure,” as even high-income countries remain committed to the growth rat race. The agricultural sector guzzles the most freshwater by far (70 percent). We find, via regression analysis, that for every million dollars in national GDP growth, freshwater withdrawals increase by an average of 2,500 cubic meters.
However, unlike most global resource extraction, freshwater withdrawals have plateaued in the 21st century. This is largely attributable to efficiency gains, especially in irrigation. In many parts of the world, however, withdrawals have plateaued or declined because of “water stress”: supplies cannot satisfy water demands.
Will we allow the suffering and conflict that stems from water scarcity to continue increasing? Or will we recognize the conflict between continued global economic growth and sustainable water use before it’s too late?
The Not-So-Natural Water Cycle
The amount of water on Earth (and in Earth’s atmosphere) does not change. Water moves continuously through a cycle. Evaporation from oceans, lakes, and soils and transpiration from plants bring water into the atmosphere. There, it condenses into clouds and falls back to Earth as precipitation. Much of that precipitation settles on land, either infiltrating into soils and aquifers as groundwater or running off into rivers and lakes. Some of this water eventually makes its way to the ocean.
The water-cycle illustrations most of us were educated on depict a “natural,” balanced system, in which long-term freshwater levels remain roughly steady. But on a planet full of GDP, any illustration that does not incorporate human economic activity does not depict reality. The system is far from balanced, as freshwater is depleted not only directly for the production of goods and services, but as an indirect effect of economic activity. Climate change represents one such mechanism.
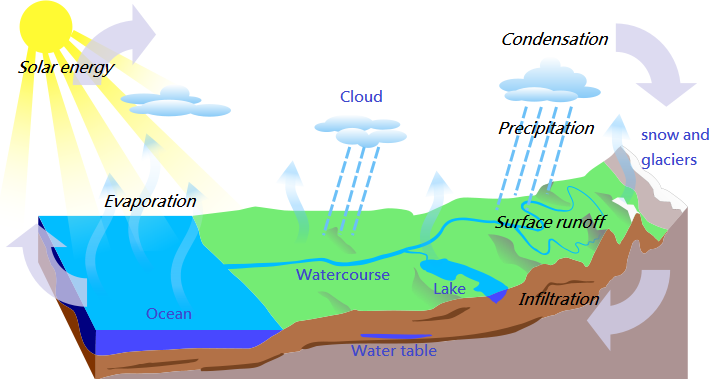
What about all the wells and dams? What about climate change? (CC BY-SA 3.0, Wikimedia Commons)
The most obvious way that warming temperatures reduce land-based water retention is via the shrinking of glaciers. At first, as water melts out of long-term glacial storage, more water is available for use. This water runoff can exceed pre-glacier-shrinkage runoff by over 50 percent. However, after several years or decades, these additional flows decline and eventually stop, as the glaciers are literally liquidated. Communities that once depended on glacier melt are left with only precipitation and groundwater.
Additionally, rising temperatures increase the atmosphere’s capacity to hold moisture. This results in longer dry periods between more intense precipitation events. In turn, this leads to drier and more compact soils, less capable of absorbing water and replenishing aquifers.
Even if climate change weren’t at play, freshwater supplies wouldn’t be able to recharge as fast as humans are depleting them. This is especially the case in arid and agricultural regions. In the United States, groundwater depletion occurred throughout the 20th century, though it has since accelerated to a cumulative one million cubic meters by 2008.
The Aral Sea in Central Asia provides an example of surface-water depletion as far back as the 1960s. Once the world’s fourth-largest lake, the Aral Sea has all but disappeared. The U.S. Colorado River provides another example of unsustainable surface-water diversion that local governments have enabled for far too long.
Though water still moves through a cycle, human pressures are causing it to spend more time in the ocean than as land-based freshwater, contributing to sea-level rise. Satellite measurements show that, on average, global terrestrial water storage from 2015 to 2023 was 1,200 cubic kilometers lower than from 2002 through 2014.
Eating Up the Freshwater
If you want to know what we’re using all that freshwater for, look down at your plate. Agriculture accounts for a whopping 71 percent of global water withdrawals. Industry accounts for 15 percent, and municipal withdrawals—what we use to drink, clean, wash, and cook—account for another 13 percent.
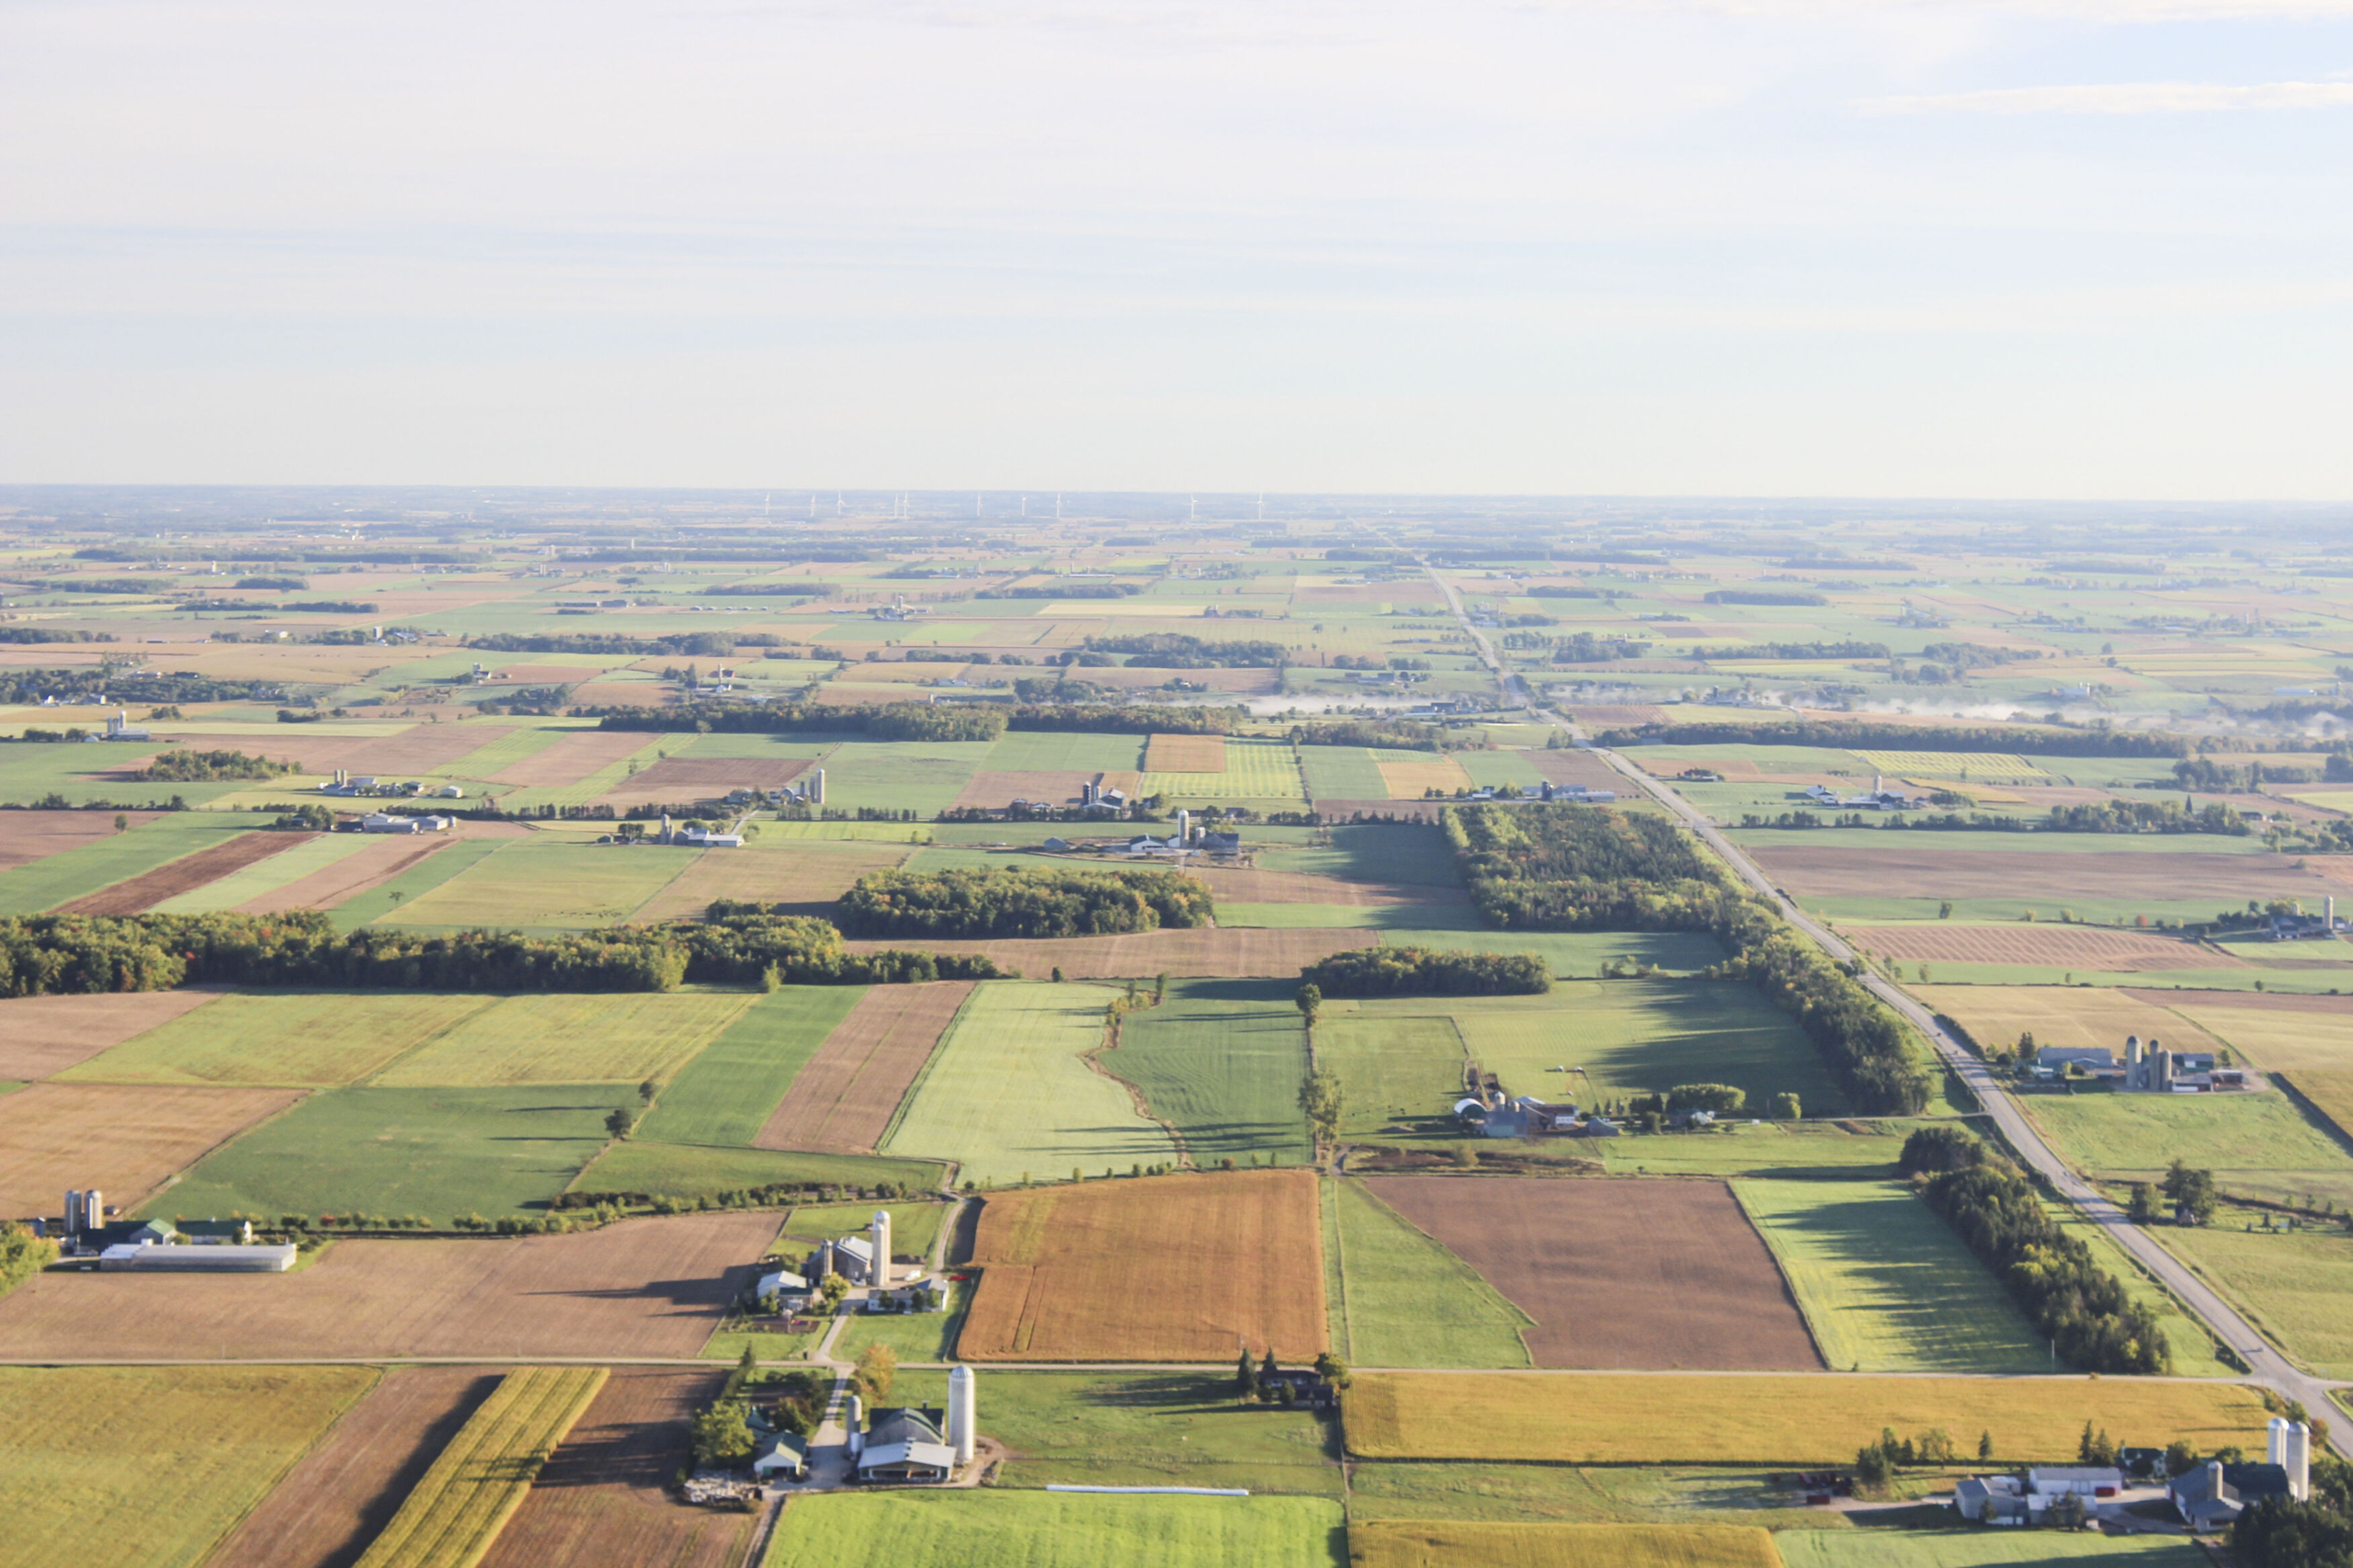
We use 26 percent of Earth’s ice-free land for livestock grazing and 33 percent of cropland to produce livestock feed. (Equalicense, Sveta Fedarava)
Most freshwater withdrawn for agriculture is used for irrigation. Much of that is fed by rivers and reservoirs, but groundwater supplies about a quarter of irrigation water. Irrigation rates reflect income and rainfall levels, with many middle- and high-income countries and arid regions relying on the technology. Low-income countries and regions with high precipitation often use rainfed systems.
Different foods require vastly different amounts of water. Animal products, especially beef, have among the highest “water footprints.” An average of 15,000 liters is required to produce one kilogram of beef. For comparison, chicken requires over 4,000 liters per kilogram and groundnuts (peanuts) require almost 3,000. Many vegetables require in the range of 200–300 liters. When accounting for feed, nearly a third of agriculture’s water footprint is attributable to animal products.
Animal-based foods also tend to yield higher economic value per unit, with global livestock production accounting for 40 percent of total agricultural GDP. This contributes to the hypothesis that more GDP requires more freshwater depletion.
GDP and Freshwater Withdrawals: A Quantitative Analysis
Clearly, the economy relies on freshwater. In particular, agriculture relies on freshwater, and the economy relies on agriculture, more than any other sector. The size of the economy is a function of a) population size and b) individual consumption levels. The more people we have, the more food we need. Our food system already falls short of providing food security for all of Earth’s human inhabitants. Lowering the global birth rate is one of the most important solutions for a sustainable food—and water—future.
The second component, individual consumption, is also crucial for water use. As incomes rise, water stress tends to increase, partly because higher-income diets include more resource-intensive foods, such as meat. Evidence suggests income growth has a larger effect on water use than population growth, though the size of that effect varies across countries and time.
To what extent is the size of the economy—whether due to population size or the consumption of high-income individuals (or both)—associated with freshwater withdrawals? To analyze the relationship between GDP and any ecological indicator, a global perspective is essential. Looking only at national withdrawals, we see that some high-income countries have decreased their freshwater withdrawals. At face value, it appears they’ve achieved “absolute decoupling,” the ultimate green-growth goal of decreasing ecological impact while growing the economy.
However, the national withdrawals metric is short-sighted in that it does not account for the “virtual water” used by lower-income countries to produce exports. In other words, high-income countries often externalize a large share of their water footprint: roughly two-thirds in the United Kingdom, three-quarters in Japan, and one-fifth in the United States. Much of this water—and the ecological impact of extracting it—is sourced from water-insecure regions.
The result of our regression analysis, using data from 1990 to 2020.
Despite this limitation, we used national-level “panel” data for a more robust analysis. Our dataset covers 129 countries from 1990 to 2020. We used real GDP at purchasing power parity from the World Bank’s World Development Indicators and freshwater withdrawals from FAO’s AQUASTAT database (accessed via Our World in Data).
For readers with some statistical know-how, we ran a two-way fixed effects model. The relationship between national GDP and freshwater withdrawals is statistically significant. On average, freshwater withdrawals increase by about 2,500 cubic meters for each additional million dollars of real GDP. That’s roughly 2.5 liters per extra dollar of GDP.
The Consequences
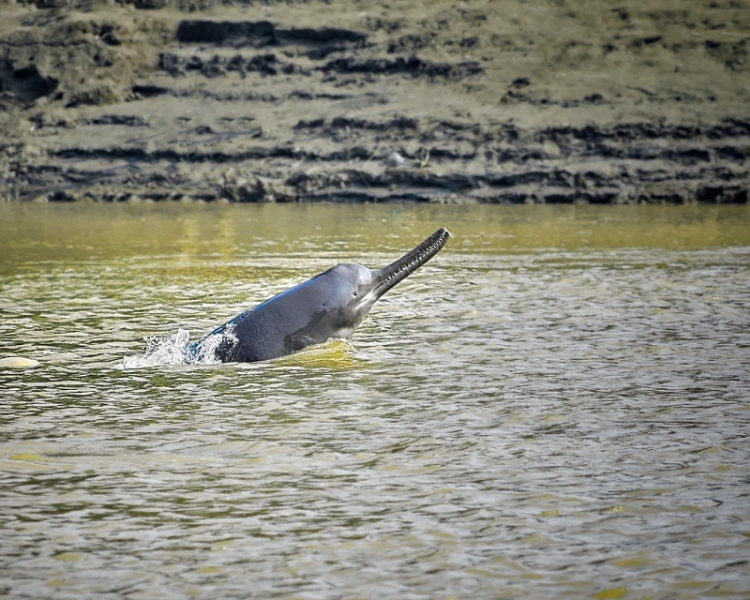
The Ganges river dolphin, one of the 24 percent of freshwater species at high risk of extinction. (CC BY-SA 4.0, Kukil Goggoi)
Ecosystems—and the priceless tapestry of species they contain—are suffering from freshwater depletion. Globally, we have lost over 85 percent of natural wetland area. Of all the world’s rivers longer than 1,000 kilometers, only 37 percent remain “free-flowing” over their full length.
The result? Freshwater species populations are collapsing faster than their marine and terrestrial counterparts. From 1970 to 2018, they declined by 83 percent compared to an average decline of 69 percent across all monitored wildlife populations.
Though the most privileged among us are insulated from this reality, the human population also depends on functioning ecosystems. In 2020, over a quarter of humans lacked access to safe drinking-water services and almost half did not have access to safely managed sanitation. The United Nations predicts that up to half of the global urban population will face water scarcity by 2050.
More Competition Means More Exploitation and Conflict
Water scarcity is often linked to exploitation. Water access is the third-most-prevalent trigger (out of 51) of the injustice cases that the Environmental Justice Atlas tracks. Freshwater is a particularly difficult resource to govern because it is constantly in motion. It flows across borders, and downstream jurisdictions often get the short end of the stick.
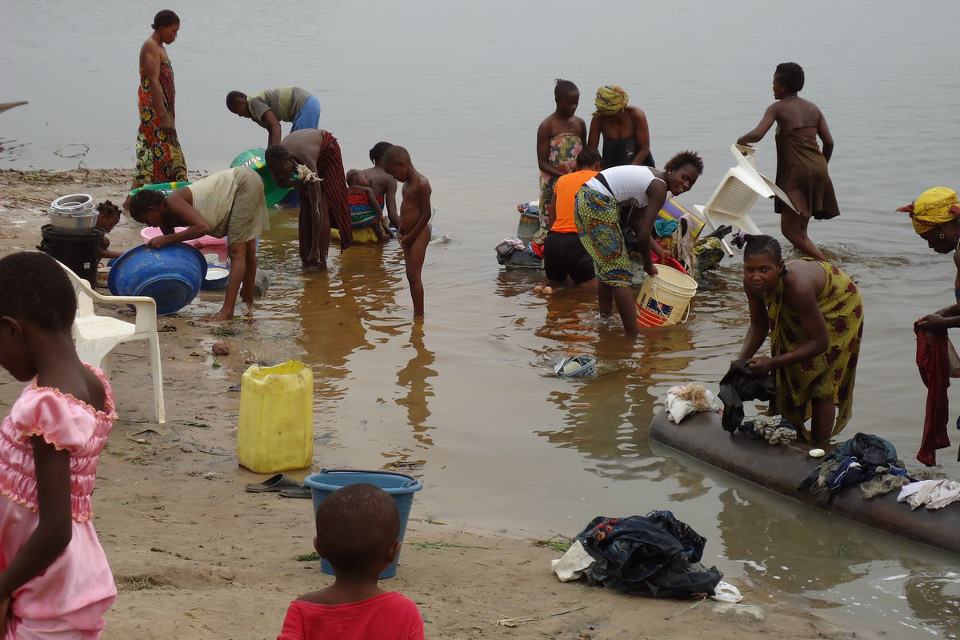
Women and girls—usually responsible for fetching water in households without in-home supplies—are most affected by the water and sanitation crisis. (CC BY 2.0, Oxfam East Africa)
Unfortunately, governments have not been proactive about cooperatively managing transboundary water sources. With operational cooperation arrangements in only 58 percent of the hundreds of shared basins and aquifer systems, we have set ourselves up for conflict. Indeed, water conflicts within and between countries sharply increased throughout the 20th century and into the 21st.
The global economy will not be able to expand as we hit the limits to growth and conflict ensues. (If it somehow managed to keep growing, this would demonstrate that GDP growth does not equal wellbeing.) In the 21st century, floods and droughts have already caused over $650 billion and $130 billion in economic losses, respectively. The UN predicts that, by 2050, water scarcity will cause some economies to shrink by six percent.
Will we wait to plunge into a recession that causes widespread suffering, or will we start taking intentional steps toward degrowth to a steady state economy?
Why Have Withdrawals Plateaued?
20th-century trends reflect the connection between economic activity and freshwater withdrawals. From 1960 to 2000, global GDP increased over fourfold, and freshwater withdrawals increased over twofold. However, in the 21st century, withdrawals have all but plateaued while the global economy has continued to grow (albeit not as rapidly). Have efficiency gains enabled us to decouple economic growth from ecological degradation?
Some degree of relative decoupling—when ecological degradation still increases alongside economic growth, but at a slower pace—has undeniably taken place. The UN’s Food and Agriculture Organization (FAO) defines water-use efficiency as “the sum of the efficiencies in the major economic sectors,” weighted according to each sector’s contribution to overall withdrawals. They estimate that global water-use efficiency has increased from $13 per cubic meter of water in 2000 to $22 in 2022. In one study, researchers attributed the freshwater-withdrawal plateau primarily to technological advances and “optimization and enhancement” of production.
Agricultural advances have been particularly important, given the sector’s dominant role in water use. Irrigation methods are perhaps the most influential example of water-saving advances. Modern dripline irrigation has been shown to use 37 percent less water than traditional “furrow” irrigation, with higher crop yields to boot. U.S. farmers decreased the average amount of water they use per irrigated acre by 25 percent from 1979 to 2022.
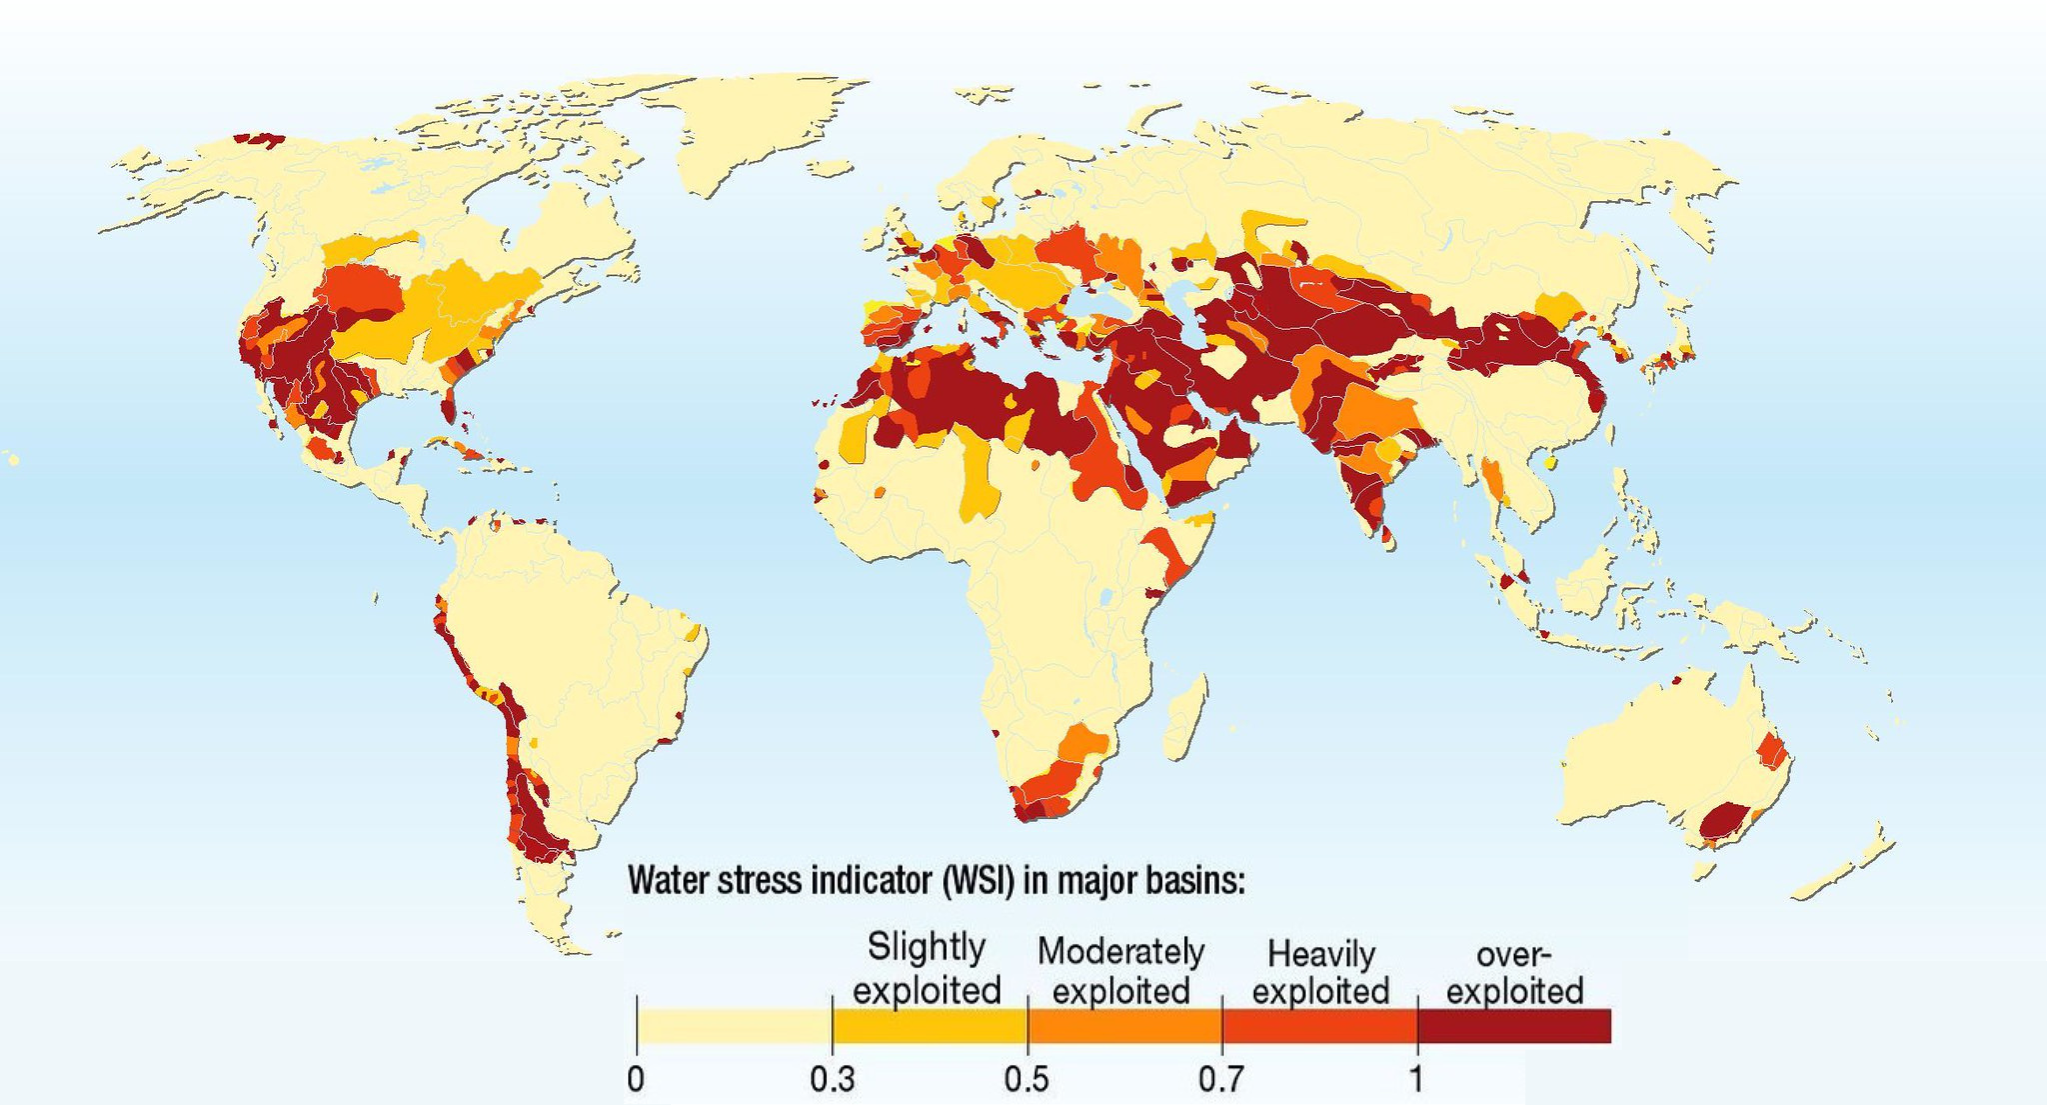
The five countries that are most water-stressed are Bahrain, Cyprus, Kuwait, Lebanon, Oman, and Qatar. (CC BY-NC-SA 2.0, GRID-Arendal)
While efficiency gains have slowed increases in freshwater withdrawals, there is another, darker driver of the global withdrawal plateau. People have no choice but to withdraw less as many sources dry up. The ratio of demand to supply, known as “water stress,” is increasing. It is highest in the Middle East and North Africa, where 83 percent of people live in “extreme water-stressed” areas (using at least 80 percent of the renewable supply). Worldwide, at least 2.3 billion people already live in “high water-stressed” basins (using 40 percent of renewable supply). This number is projected to rise to 4.2 billion by 2100.
At this rate, efficiency gains won’t be enough to halt freshwater depletion (especially when one considers that efficiency gains can lead to more overall consumption). The economy will start to hit its head on the ceiling for the resource most critical to its survival.
It’s time to splash our faces with cold water, ask how and at what cost that water made it to our taps, and recognize that our economy can’t keep growing exponentially. Fresh with that realization, we can start planning for degrowth toward a steady state economy that extracts freshwater no faster than nature replenishes it.
 Alix Underwood is managing editor at CASSE.
 Marwa Ebrahem is a master’s student in Applied Economics at The George Washington University and a Research & Insights Intern at CASSE.


Thank you for this very timely article. One of my work colleagues is in Washington state in the US, and he has mentioned how farmers in eastern Washington (east of the Cascades mountains) are in great distress because they are trying to compete with data centers for limited fresh water.
It’s an incredibly unsustainable and foolhardy situation that we’re in.
Excellent article. I intend to share where and whenever I can. Good for raising water awareness and water consciousness. Thank you.
The following quote from the The People’s Commission on the Water Sector – 2025, UK. ; might interest you: “the future for water relies on a water conscious society”
Thank you for your interest and encouragement, Cole and Geoffrey! My focus of study used to be freshwater, but it’s been a while. I learned so much (mostly disturbing) researching for this article. And yes, data centers are particularly frightening, from water and energy perspectives!
The Saudi politician Ahmed Zaki Yamani said that “The Stone Age did not end for lack of stone, and the Oil Age will end long before the world runs out of oil.” This is used to support ongoing economic growth through constant innovation. There are good reasons to doubt those predictions, and nowhere more so than with fresh water. Short of a physiological reboot, running out of water is a dead end. Thanks for spelling out the issues so thoroughly and clearly.
Worse still, is believing that the Oil Age will end only when a cheaper energy substitute emerges. The Oil Age should have already ended because the Earth cannot assimilate the carbon byproducts sufficiently to avert destructive climate change. GDP growth and the associated growth in throughput (input of natural resources/output of waste) is strictly limited by the most limiting ecological factor. In the case of freshwater, humankind passed the freshwater planetary boundary between 2015 and 2023 (Stockholm Resilience Centre). Four planetary boundaries had already been transgressed by 2015. As of 2025, seven of the nine planetary boundaries have been transgressed.
More important than becoming a water conscious society is abandoning our GDP growth obsession, since the transgression of seven planetary boundaries to date has the same underlying cause – growth beyond the Earth’s carrying capacity. We need to become a steady-state (beyond growth) conscious society, and nothing less.
Good points, Philip, about the severity of the problems and about the value of turning away from constant growth. Unfortunately, most people including politicians are not noticing—or maybe just hoping they will be on the “lifeboats” of prosperity while others suffer.
The next frontier for advocates of limiting growth will be finding ways to show more politicians and other people the importance of change by design rather than by disaster in the words of economist Peter Victor.
Reply to Paul J Croce: The problem is that the world is run by psychopaths who only care about themselves and their cronies. It’s been that way since the emergence of agriculture, which freed the hands of people and led to all sorts of things – in particular, the rise of psychopaths.
In hunter-gatherer societies, psychopaths are ostracised and are forced to tolerate an oikonomic way of existence or go on alone and perish.
Ruling psychopaths have had to make concessions from time to time, but only the minimum necessary to maintain stability of the system that gives them their power and wealth. In more recent times, historically, one of these concessions has been a parliamentary system of government and voting rights (gradually extended) that gave the masses the impression that power was being shared. All it did was give the rich and powerful the ability to legislate with the full backing of the constabulary and defense force. When they are not legislating to make minor concessions to the masses, they are legislating to maintain their power and increase their wealth. Genuine democracy is, and always has been, an illusion.
Reply to Paul J Croce (continued (1)): The ruling psychopaths allow some of the wealth to trickle down to the masses – it is another concession to the masses to maintain stability of the system. However, since psychopaths engage in chrematistic behaviour, and chrematistics sows the seeds of its own destruction, the system eventually collapses. It’s happened many times in the past – it brings down entire empires – and it has happening now.
In the past, the pieces left from collapsed civilisations were sufficient to start the process all over again. Sometimes circumstances (e.g., WW1-Great Depression-WW2) reduce the power and wealth of the psychopaths sufficiently to bring about a period that comes reasonably close to oikonomia (e.g., the immediate post-WW2 period). But then the psychopaths reorganise (e.g., the Mont Pelerin Society and Powell Manifesto), regain some of their wealth, and pounce at the right moment (e.g., following the inadequate response to the 1970s stagflation/oil price shocks and the Limits to Growth imperative). They regain control and reconfigure economies on chrematistic principles (neoliberalism is simply institutionalised chrematistics) and the system is pushed to its limits again (where we are now) until it collapses (where things are headed). The problem this time is that the pieces left will not be of the same quality as they have been in the past. Natural capital stocks will be seriously depleted, ecosystems will be collapsing, climate change will be a run-away phenomenon, and there will be 8+ billion mouths to feed.
I have no idea how we depose the ruling psychopaths in a peaceful way. I’m not advocating violence, because I detest violence. But you can be sure that the ruling psychopaths won’t give up their power and wealth without a fight. They already indicate how much they like to fight (engage in wars) to maintain their power and wealth.
Reply to Paul J Croce (continued (2)): If we are to change things for the better in a peaceful way (assuming it is possible), we need to focus on reforming our political systems and institutions, as well as reforming our way of thinking, living, and policies. I can’t see any real progress while our current political systems remain as they are.
Thanks, Phillip, for this wonderful statement about how bad things are. Your comments offer important reminders that as serious as are our environmental and economic problems, still more serious is our politics, which is diverting attention from those problems. And I’ll add, still more (more more!) serious are cultural attitudes that sustain those political trends.
Now what? You conclude that “we need to focus on reforming our political systems and institutions, as well as reforming our way of thinking, living, and policies.” Important political and cultural goals. How to get there?
My point is to use the resources we have to take on those challenges, to show the importance of calming growth for healthier human-nature relations. Easy to do? No. Currently outnumbered? Yes. Currently overshadowed by powerful people and powerful habits? Yes in thunder.
We are currently in the equivalent of a chronic medical condition: Many and long paths into current ways now normalized, and it will take a while to get out. There is no guarantee that we will change quickly enough.
But the conditions compel. We’ve got to try, and we have some resources. Listen to how the other half thinks. Work against the destructive and manipulative. Speak truth to power. Speak awareness to the distracted. Persuade the uncertain. Critique the bad. Perhaps most importantly, show the good possibilities. To appropriate a phrase from Florida popular culture, Ladies and gentlemen, start your mental and emotional engines for improving the world we’re all in! Louis Armstrong reminds us, it’s still a wonderful world, https://www.youtube.com/watch?v=CaCSuzR4DwM. Show that.