Measuring Ecological Limits: The United States and the World
by Peri Dworatzek
Footprint accounting 101.
The science is clear: Our rate of economic activity is having disastrous impacts on the environment, starting with the climate so crucial to our survival. Economic activities require the use of natural resources and systematically entail pollution. Resources eventually get used up, as does the capacity of the planet to assimilate waste. We are reminded of Herman Daly’s long-running emphasis that the economy is a subsystem of the environment, not the other way around.
Expanding on this, steady-state economists and other post-growth advocates argue that economic growth cannot be decoupled from material throughput. This can be explained with the trophic theory of money, which follows from the trophic structure of the economy of nature. Agriculture and extraction comprise the trophic foundation of the economy, and all other sectors rely on that trophic base. Therefore, we cannot rely on “dematerialized” sectors to grow the economy while decreasing its disastrous impacts on the environment.
Therefore, consumption must be reduced, particularly in high-income countries that consume more natural resources and release more waste. But just how much do high-income countries need to reduce their economic activity to be sustainable? Two metrics help us understand sustainable limits by quantifying the relationship between the environment and the economy: ecological footprint and biocapacity.
The Conceptual Framing of Ecological Footprint and Biocapacity
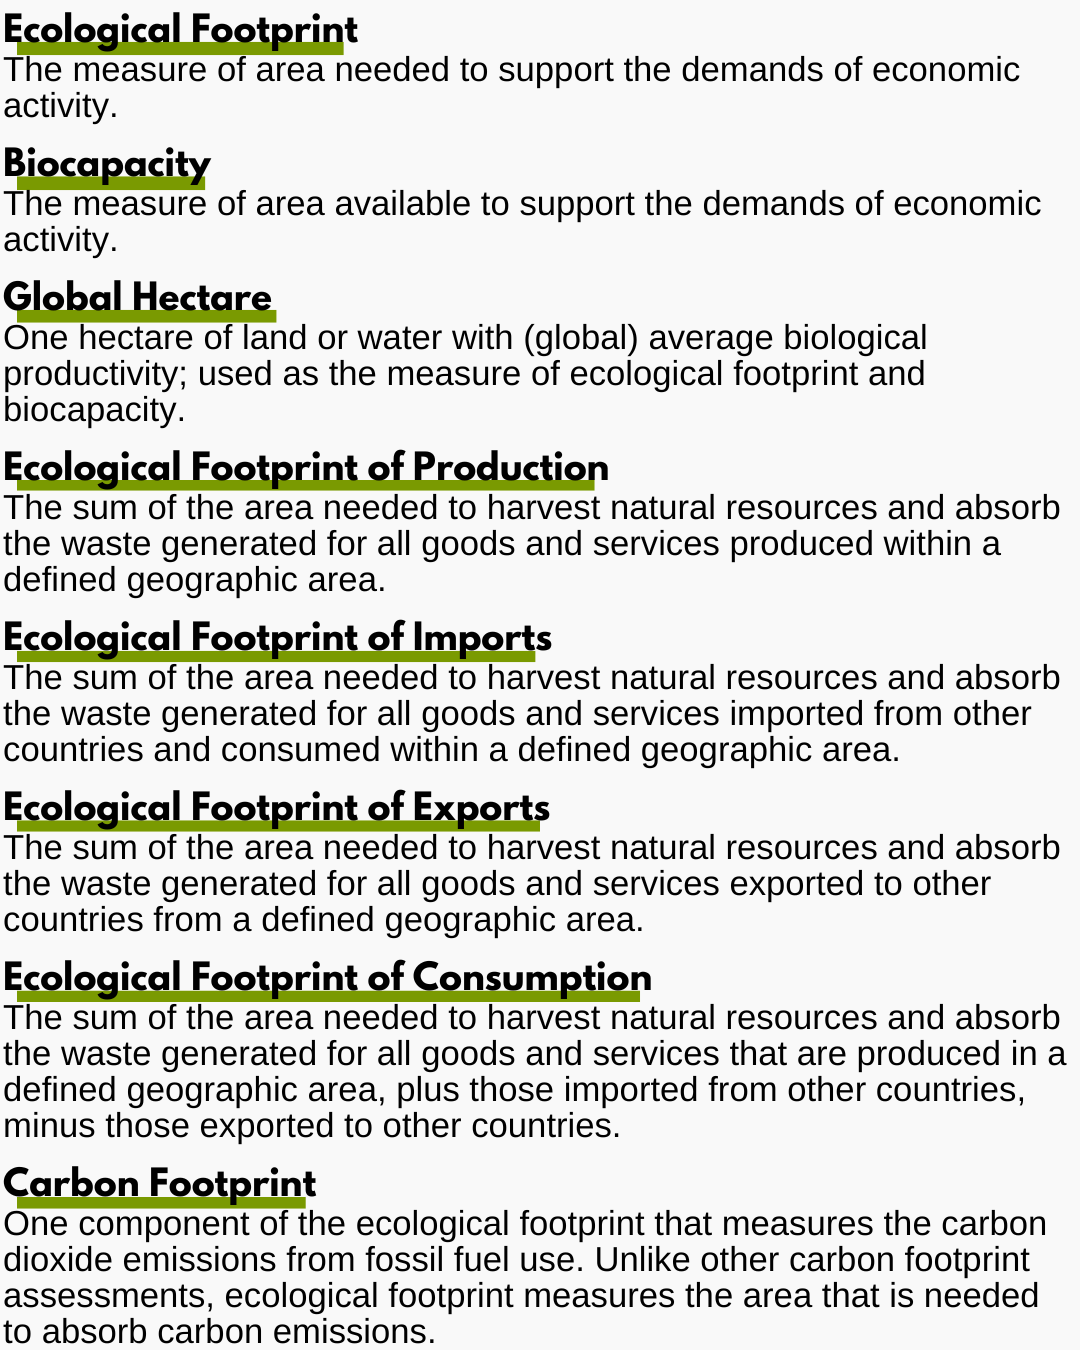
The ecological footprint is a measure of the area needed to support the demands of economic activity. Biocapacity is a measure of the area available to supply natural resources and absorb waste at a sustainable rate. When the ecological footprint exceeds biocapacity, that indicates ecological overshoot. The Ecological Footprint Initiative has been measuring global ecological footprint and biocapacity since 1961. We have been in overshoot since 1971.

Global ecological footprint divided by global biocapacity, split by footprint components, from 1961 to 2024, with the red line emphasizing the overshoot threshold. (National Ecological Footprint and Biocapacity Accounts, CC BY-SA 4.0)
The ecological footprint and biocapacity are made up of comparable components, including cropland, grazing land, forest land, fishing grounds, and built-up land. In addition, ecological footprint includes a carbon component.
Scientists measure ecological footprint and biocapacity with a unit called the global hectare. They convert the productivity of different ecosystems to global hectares based on the world average productivity of a hectare. This enables comparisons between different land types, places, and years.
Ecological Footprint and Biocapacity of the United States
The United States has a high ecological footprint that is larger than its biocapacity. In 2022, there were roughly one billion hectares across the United States. When categorized into the biocapacity components and compared to global average productivity, this equates to 1.25 billion global hectares (gha) of biocapacity.

Area, biocapacity, and ecological footprint of the United States in 2022. (National Ecological Footprint and Biocapacity Accounts, CC BY-SA 4.0)
In other words, U.S. land, most notably cropland and forest land, was more productive than the global average. The average biocapacity of one hectare of U.S. cropland was 3.7 gha. One hectare of forest land provided an average of 1.6 gha of forest land biocapacity. However, this above-average biocapacity of cropland and forest land does not indicate sustainability. The country’s total ecological footprint is far higher than its total biocapacity.
In 2022, the U.S. ecological footprint of production was over 2.5 billion gha. This was similar to the ecological footprint of consumption, because the footprints of imports and exports were nearly equal. However, there were differences among the footprint components of imports and exports. The carbon component was more prominent in the ecological footprint of imports, whereas the cropland component was more prominent in exports. This means the United States imported more carbon-intensive goods and services than it exported, and exported more cropland-intensive harvests than it imported.
U.S. Trends: Better or Worse?
One good sign is that total U.S. biocapacity has been increasing over time. In 1961, total biocapacity was just over 1 billion gha, and by 2024, biocapacity had grown to 1.3 billion gha (2023 and 2024 data were forecasted).1 This is because of increases in agricultural productivity. Biocapacity is a measure of what the environment can provide for human use, not of biodiversity or ecosystem health. In fact, it has a negative correlation with biodiversity indicators. Cropland illustrates this tension well, as using fertilizers and chemicals can increase agricultural productivity at the expense of ecosystem health.

Ecological footprint, biocapacity, and population of the United States from 1961 to 2024. (National Ecological Footprint and Biocapacity Accounts, CC BY-SA 4.0)
The U.S. population has also been increasing over time, which has decreased biocapacity per person. In 1961 biocapacity was 5.7 gha/person, and in 2022 was 3.8 gha/person.
Meanwhile, the U.S. ecological footprint of consumption has been increasing. In 1961 it was 1.6 billion gha, and by 2024 it reached 2.5 billion gha. Counteracting that increase to some degree is the per-person ecological footprint of consumption, which has decreased in recent years. In 1961, it was 8.9 gha/person, and in 2022, it was 7.9 gha/person. Although this is not a huge reduction, it provides a glimmer of hope that the country can reduce its footprint per person to offset population growth. However, it would need a very sizeable reduction to retreat to the safe operating space of its biocapacity.
In summary, the best available ecological footprint and biocapacity science reveals that the United States is exceeding a sustainable level of resource use for the production and consumption of goods and services. In 2022, the ecological footprint of consumption was 7.9 gha/person, and biocapacity was 3.8 gha/person. Ecological footprint is more than double biocapacity, meaning that economic activity is (over) two times the amount the United States can sustain. And with its outsized carbon footprint, the American economy is impacting the biocapacity of ecosystems on Earth.
Diving Into the Footprint Details

The average American travels forty miles per day, taking a toll on the climate and mental health. (Raysonho, CC0 1.0)
The carbon component makes up 64 percent of the ecological footprint embodied in the consumption of goods and services in the United States. Almost all of this carbon component (95 percent) comes from fossil fuel emissions. The largest share of these emissions (37 percent) comes from transport, of which road transport constitutes the majority. The next-largest share of U.S. carbon emissions (34 percent) comes from public and private utility companies producing electricity and heat for sale to third parties.
For many people, these details highlight the importance of decarbonizing electricity and heat generation and shifting transportation to less emissions-intensive modalities, such as rail. However, the emissions reductions needed to bring the United States back within its biocapacity are so immense that “green” alternatives aren’t sufficient. Americans must also reduce consumption of electricity and heat, as well as the distance they travel, because “green growth” is not possible.
In 2022, cropland made up 18 percent of the U.S. ecological footprint of consumption. Of the cropland ecological footprint, 84 percent was used for crops consumed by people and pets, 15 percent was used to feed livestock, and less than 0.5 percent was used to feed fish. Almost 700 million metric tons of crops were harvested, and just over half was maize. The second most harvested crop was soybeans at 17 percent of total harvests.
Yet the proportion of ecological impact does not equal the proportion of total harvests. For instance, maize made up 52 percent of crop harvests (metric tons) and 43 percent of the cropland ecological footprint of production (gha) in 2022. On the other hand, soybeans accounted for 17 percent of harvests (metric tons) and 32 percent of cropland ecological footprint of production (gha). Therefore, soybeans had almost double the ecological impact per metric ton of harvest in the United States.
The United States in the Global Context
The United States consumes far more than its share of the Earth’s natural resources. The global average ecological footprint of consumption was 2.7 gha/person in 2022. The United States crushed that benchmark at 7.9 gha/person. The average U.S. citizen consumed resources at almost three times the rate of the average global citizen.
Here’s another way of thinking about this: The United States is responsible for twelve percent of the world’s ecological footprint of consumption. Yet the U.S. population only amounts to four percent of the world population. This represents a highly disproportionate environmental impact.
The U.S. ecological footprint per person is even higher than that of most other high-income countries. The average ecological footprint of consumption in high-income countries is 6.1 gha/person.
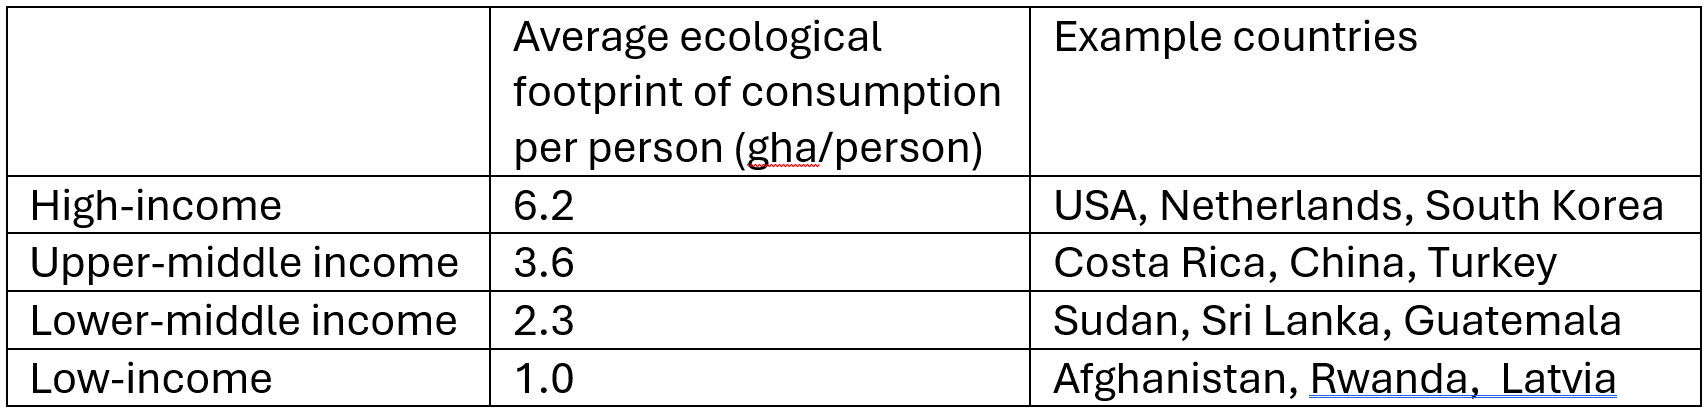
Average ecological footprint of consumption per person (2022) by World Bank income classification, with example countries. (National Ecological Footprint and Biocapacity Accounts, CC BY-SA 4.0)
There are important debates about best practices for presenting ecological footprint and biocapacity data. Often, the ecological footprint of a territory is compared to the biocapacity of that territory. For example, U.S. ecological footprint is compared to U.S. biocapacity. This implies that a country achieves sustainability if its ecological footprint is lower than its biocapacity.
Many criticize this approach as an unfair representation of sustainability, because some countries are blessed with exceptionally high biocapacity. For instance, in 2022, the ecological footprint in Canada was 8.4 gha/person, and the biocapacity was 14.4 gha/person. Canada’s biocapacity was clearly higher than its ecological footprint. However, its ecological footprint per person was in the top ten highest in the world. Therefore, perhaps it is also important to compare a country’s ecological footprint to world average biocapacity (global ecological balance) in addition to the country’s biocapacity (local ecological balance).
In 2022, global biocapacity was 1.5 gha/person, significantly lower than the U.S. ecological footprint of 7.9 gha/person. In other words, U.S. citizens consume resources and emit carbon at five times the global average sustainable rate.
Ecological footprint and biocapacity data illustrate that we are using natural resources and releasing waste at unsustainable rates, in the United States and around the world. It shows that this has been happening for decades. The United States and other high-income countries are disproportionately responsible for this state of overshoot. They must pump the brakes on resource consumption and waste emissions if we are to exist within local and global sustainable limits. They must pump the brakes, in other words, on the economy.
1 Except where otherwise linked, all data referenced in this article is sourced from the National Ecological Footprint and Biocapacity Accounts, which are produced by researchers at the Ecological Footprint Initiative for the Footprint Data Foundation.
 Peri Dworatzek is a senior research scientist at CASSE and a partnership coordinator at the International Ecological Footprint Learning Lab.


All of this is no surprise to those who have been paying attention. I would love to see an article (or two) that speculates on what we in the US would need to do to live within or below our biocapacity limits. How would our many energy/agriculture/transportation/etc systems need to be reorganized? Also, how is our median footprint different than average? Median footprint per capita would give more of a hint about how income inequality affects our footprints.
Thanks for the suggestion DP. This is something I had in mind for a future article! I can also use United Nations population scenarios to examine how much needs to be reduced with different rates of a growing population. Maybe this is looking like multiple articles…
I also appreciate your point about comparing median ecological footprints to investigate income inequality. This would be possible if we had ecological footprint assessments for every person or household across the country (alas we do not). These kind of assessments are often done using ecological footprint calculators instead of national scale accounting of specific harvests, derived products, and services. Individual / household ecological footprint assessments is actually the scale that I’m conducting my PhD research at York University.
There’s a glimmer of hope here, maybe. If the US can de-carbonize, it’s not enough, but it gets the US quite a lot closer to a sustainable situation. From the numbers presented, unless I missed something, it looks like a quite decent quality of life is possible, even with adjustments to be sustainable. In other words.. this is all do-able.
I hope the US can follow the lead of my homeland, California, and really embrace renewable energy. 10 years or more ago people pointed warning fingers at California as being too enamored of solar and wind, and it would never work, look at the power outages they have, and so on. But we studied the problems, and worked on them, and invested wisely, and engineered breakthroughs, and repeated that loop, and overall things are pretty nice now. It’s not completely done yet, but California is showing that de-carbonization really is do-able over time.
Hi Cole, I agree. I think it is do-able to maintain quality of life while reducing ecological footprint to be within biocapacity limits. Following a Post-Growth ideology, I think it’s possible to increase wellbeing by focusing on improving inter-personal aspects of our lives (e.g. quality of work and relationships) while reducing ecological footprint. This is another great thing about using the footprint metric – it can easily be analyzed alongside wellbeing metrics (e.g. Human Development Index or World Happiness Report).
All well and good but how do you get municipal and state officials to integrate environmental and ecological footprints into annual economics and budgets? A well- being budget and quality of life lower living cost factors are extremely difficult to
convey to elected officials who don’t even have basic knowledge of municipal governance and administration skills.
The environment as our economy and natural resource limits are foreign to them. Giving service departments (police, fire, DPW etc.) priority over that of resident taxpayers and merely accepting departmental annual budgets is not creating or developing a legitimate budget. Any reduction in budgets is seen as a decrease in services which is false but how is this mindset broken? The pro-growth and development only see perpetual building as an economy. Need to tie financial stability of taxpayers to the municipality’s financial stability and even that will be a hard sell.
Any thought s will be appreciated.