Tons, Hectares, or Dollars? Measuring the Pressure Exerted by the Economy on the Biosphere
by Gregory M. Mikkelson
Like a doctor measuring a patient’s vital signs, environmental scientists use various indicators to assess the health of the global ecosystem. These planetary vital signs are reckoned in a variety of units, such as tons of greenhouse gas emitted or hectares of land deforested. Meanwhile, conventional economists try to measure everything in terms of dollars (or other currencies). For example, they assign monetary values to the “ecosystem services” provided by nature, such as pollination by bees or erosion control by tree roots.
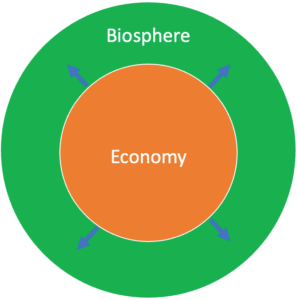
As the economy grows, it competes with the biosphere for resources.
In 2005, some conservationists proposed GDP as a proxy for biodiversity loss. Their proposal runs counter to the conventional perspective that the environment should be protected in order to boost monetary values like GDP. Instead, it implies that GDP should be limited in order to protect the environment. Nonetheless, as with mainstream economics, the conservationists’ proposal would express environmental damage in dollar terms.
How good a proxy is GDP for biodiversity loss? To answer this question, let’s pit GDP against two leading rival metrics of the pressure exerted by the economy on the biosphere: material extraction and ecological footprints. After introducing these two metrics below, I compare how well the three metrics predict the depopulation and extinction of our fellow species.
Three Indicators of Economic Pressure
One important indicator of the pressure exerted by the economy on the biosphere is the total mass of raw materials extracted from nature, transformed into goods and services, used up, and finally discarded as waste. This metric includes biomass, fossil fuel, metal, and other minerals. It is closely related to the Wuppertal Institute’s “ecological rucksack” concept and the analysis used in the World Resources Institute’s Weight of Nations report. While the material extraction indicator is quite comprehensive, one may fairly wonder how meaningful it is to lump such disparate categories as iron ore and cattle feed together in terms of sheer tonnage.
Ecological footprints zero in on the biological part of this extraction, such as crops, livestock, fish, and wood. Footprint scientists translate the yields of these resources from units of mass into units of the area required to grow them. They also throw in the area taken up by buildings, roads, etc., and the area of unlogged forest it would take to absorb all the CO2 emitted through combustion of fossil fuel. Ecological footprints are measured in terms of “global hectares,” a unit of area that corrects for differences in the biological productivity of different ecosystems, such as forests (more productive) vs. pastures (less).
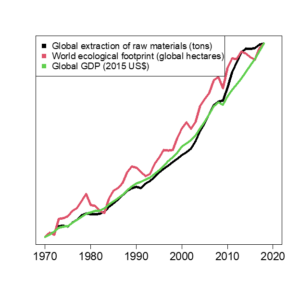
Three measures of environmental impact. (United Nations Environment Programme, Global Footprint Network, World Bank)
What about GDP? Like the material extraction and ecological footprint metrics, GDP represents a huge number of disparate items. But instead of quantifying these items in terms of the materials, land, and/or water they embody, GDP results from the prices they command.
According to the trophic theory of money, the wherewithal to pay for these goods and services waxes and (sometimes) wanes with agricultural surplus and to a lesser extent our extraction of fiber, metals, and other natural resources. Because such agricultural and extractive activity is bound so clearly to environmental damage, Brian Czech concludes that GDP “must indicate environmental impact, invariably and inevitably,” although he acknowledges several distorting variables such as inflation and international trade.
Material extraction, ecological footprints, and GDP thus overlap in the economic activities they track, but they use very different units. Which indicator does a better job of predicting biodiversity loss?
Impacts on Biodiversity
At the global level, material extraction, ecological footprints, and GDP all have strongly negative, and roughly equal, correlations with the Living Planet Index (LPI). The LPI summarizes population trends across more than 5,000 wild species. As our three metrics of economic pressure have surged, populations of our fellow species have plummeted by an average of 69%. So this global-level test does not offer a basis for discriminating among our three measures of economic activity.
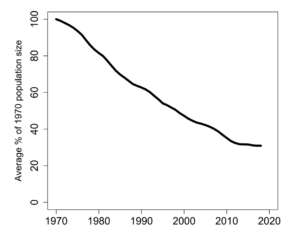
Monitored populations of various species have fallen steadily since 1970.
At the national level, we can compare how well extraction, footprints, and GDP predict changes in the Red List Index of species survival (RLI). The RLI ranges from zero to one, with zero meaning that all species in a given country are extinct, and one meaning no species are extinct or threatened with extinction.[1] Across 129 countries and the 27 years 1993-2019, all three measures of economic pressure have statistically significant negative correlations with the RLI. But ecological footprints and GDP explain variation in the RLI quite a bit better than material extraction does. Our national-level test thus provides a reason to favor ecological footprints and GDP over material extraction as indicators of biodiversity loss.
Which of the Three is Best?
Unfortunately, large gaps in our knowledge of biodiversity make the LPI and RLI imperfect criteria for choosing among material extraction, ecological footprints, and GDP as the best indicator of biodiversity loss and other aspects of overall environmental impact. The best strategy is no doubt to use more than one of the three—especially since they have complementary strengths and weaknesses.
A point in favor of material extraction and ecological footprints is that they were each specifically designed to track the depletion and pollution of nature. Moreover, ecological footprints were uniquely designed to assess when and by how much the economy overshoots nature’s “biocapacity” to supply goods and services to humanity every year. GDP, by contrast, was designed to measure economic activity, rather than directly assess the environmental impacts of such activity, or the degree to which humanity is overshooting Earth’s carrying capacity.
When GDP conflicts with more direct measures of environmental impact, I’m thus inclined to believe the more direct measures. For example, I reported a few weeks ago that Canadian material extraction per capita massively exceeds that of the USA. Yet GDP per capita is substantially lower in Canada than in the USA, even after correcting for purchasing power. Which indicator—GDP or extraction—better reflects overall per capita environmental impact? In this case, we should also consider that fossil fuels, which are driving us ever further into climate chaos, make up most of the raw material extracted in Canada. I therefore submit that Canada has a higher overall environmental impact per capita, despite having a lower GDP per capita.

Three views of Montreal (Wikipedia)
On the other hand, because GDP does strongly correlate with biodiversity loss and other indicators of environmental impact, it can be used when and where those other indicators are not available. This goes for the vast majority of sub-national governments that already track GDP, but perhaps cannot be expected to take on the task of totting up their populations’ material extraction or ecological footprints any time soon. For example, the Wikipedia page of Montréal, where I live, lists its GDP, whereas ecological footprints have been calculated for only a handful of cities around the world.
So how good an indicator of biodiversity loss is GDP? It certainly points in the right direction, with higher GDP reliably correlated with greater biodiversity loss. Yet other indicators, like material extraction and ecological footprints, quantify the proximal drivers of biodiversity loss more directly, specifically, and explicitly. For sub-national governments that lack these finer tools, GDP should do reasonably well. The challenge will be convincing these governments that GDP is a bad measure of “economic health,” but actually does a pretty good job as a “gilded index of far-reaching ruin.” Demonstrating the utility of GDP as an indicator of environmental impact will help do just that.
[1] Although the RLI is not as sensitive as the LPI is to species’ changing population sizes, it is available at the national level whereas the LPI is not.
Greg Mikkelson is CASSE’s Ecological Economist.


Good arguments to use each of the three: material extraction, ecological footprints and GDP. From a political-discourse activist perspective, I suggest that GDP is a “better” badguy to aim at. Here I propose two reasons. (1) “economists” often cite the need for material extraction in order to boost GDP but not the other way around. They are most blinded by GDP. (2) Some well-meaning green-growth folk argue that it is possible to lower ecological footprint and still bolster GDP. They too are most blinded by GDP. Both economists and green-growthers need to learn that lowering the GDP in a sensible way can and will improve both health and quality of life. On the other hand, looking at Greg’s Canada example, “Leave it in the ground” might work better. So I’ve contradicted myself.
Surely the key is to target the areas of economic activity that are causing harm. Broadly sweeping for a gdp reduction seems to target all activity, there may be areas of economic activity we want to do more of, eg, renewable energy reforestation, social connection.
Conor, I’m a bit surprised to be saying this, after the many insightful comments you’ve left, but I think you missed the mark on this one.
Make no mistake: What distinguishes CASSE, along with most of the post-growth/degrowth movements, is our emphasis on the economy as a whole. “It’s the economy, friends,” as a president might have put it less obnoxiously than the one advised by James Carville.
There is a plethora of individuals and organizations focused on particular pollutants, extractive activities, and socially scummy consumption behaviors. That’s important, but far from sufficient for the big prize of sustainability. Sustainability is a steady state economy. And an economy grows as an integrated whole (trophically integrated, as the article reminds us). Picking and choosing among sectors and products to push back against, while good for many other purposes, doesn’t get us to a steady state.
You may recall a metaphor favored by Herman Daly: the plimsoll line, painted on the hull to tells us if the ship is overloaded. As with an overloaded ship, the cargo of Spaceship Earth is too much. We’re in a condition of overshoot.
Here’s what I think the steady-state captain of the ship would say: ‘When she’s loaded to the plimsoll line, it doesn’t matter if you add a puppy or a pig; she’s sunk!’
Brian I fully get it that compounded economic growth swiftly leads to depletion. The point I am conveying is that the earth can carry only a certain level of econmic activity. An optimal activity mix. As we strive to move down to that optimal mix of activity there will likely be some current sectors that may need to increase to be at an optimal level. Eg renewable energy, and maybe more social connection, education, communication for better common understanding and peace. Continuous growth of anything is unsustainable.