Rooted in the Earth: The Economy Needs Agriculture
by Alix Underwood
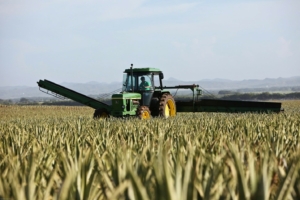
Industrial agriculture has increased the number of mouths fed per farmer. At what cost? (Dietmar Riechle, Unsplash)
Though it’s easy to lose sight of, with our language and culture and smartphones, Homo sapiens is an animal species that exists within natural ecosystems. All our activities, including our economic activities, take place within and depend upon these ecosystems. This is the starting point for the trophic theory of money (TTOM).
“Trophic” refers to the flow of nutrition and energy. In the economy of nature, plants (producers) provide energy to herbivores (primary consumers), which provide energy to carnivores (secondary consumers). Essentially, plants are “goods” consumed by primary consumers, which themselves are “goods” consumed by secondary consumers.
Similarly, in the human economy, agriculture and extractive activities provide goods that are used in heavy manufacturing. These provide goods for light manufacturing. Services evolve to assist with the goods-producing sectors, and in some cases for final consumption (for example, entertainment).
The TTOM is that money originates via food surplus that frees up hands for the division of labor into other economic sectors. Throughout history, civilizations from Mesopotamia to ancient Greece began devising money only after substantial agricultural development, including a reliable food surplus. Food surplus can refer to many things, but in this case, we mean a surplus in mouths fed per farmer. In other words, when farmers produce enough to feed others in addition to themselves.
This is not some detached theory about societies long gone; it has implications for today’s $105 trillion global economy. No matter how big the economy gets, an increase in economic activity requires farmers to produce more food. This allows more people to extract and build and deliver more goods and services. Policymakers and economists have lost sight of this fundamental relationship between food production and the overall economy. Yet it is vitally important for us to recognize that our economic growth machine relies on the very natural resources it degrades.
To apprise publics and policymakers that economic growth stems from growth in mouths fed per farmer, it behooves us to provide empirical evidence. A lot of good data and a complex analysis would be necessary to establish this causal relationship. I have taken a stab, with decent data and a simple analysis to start. Herein, I share the results of the first step: a correlation between food supply per farmer and real gross domestic product (GDP).
Global Data for a Global Study
I am not the first person to investigate the relationship between mouths fed per farmer and the economy. Many studies have analyzed the effects of related indicators on GDP. These include agricultural productivity and the share of agriculture in the economy. These studies largely corroborate the TTOM. They, find that higher productivity and a lower share of agriculture lead to a higher GDP.

Food produced by a farmer in one country may feed mouths in other countries. For this reason, we need global data to test the TTOM. (geralt, Pixabay)
However, most of these studies are at the country level. For testing the TTOM, global data is the best approach, because international trade may hide the effect we’re looking for. A country that imports most of its food could have a decreasing food supply per farmer with an increasing GDP, balancing its national accounts with other goods and services. One likely reason for the absence of global studies is that good global data is hard to come by.
The United States Department of Agriculture’s Economic Research Service (ERS) uses data from various sources to estimate the number of economically active adults primarily employed in agriculture worldwide.[1] The United Nations’ Food and Agriculture Organization (FAO) provides estimates of food supply per capita per day (in kilocalories). This is an annual average of the quantity of food available for human consumption at the end of the supply chain per day. I combined these two variables to create a new metric that is more relevant to TTOM: food supply per farmer per day.
For an economic growth variable, I used World Bank data on real GDP in U.S. dollars, pegged to 2015 to adjust for inflation. The World Bank uses national accounts data to estimate global GDP. This data, along with the food supply per farmer data, are used with a grain of salt. Differences in accounting methods among countries make the accuracy and comparability of the data less than perfect.
A Moderately Strong Relationship
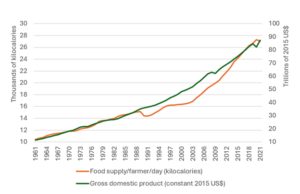
Food supply per farmer per day and real GDP from 1961–2021. (ERS)
It helps to start with a simple visualization, such as the line graph to the right. Such graphs can be misleading, as the two variables use different units, but they give a general sense of trends. Clearly, both variables have increased over time, with food supply fluctuating relatively more than real GDP.
Another useful visualization is a scatterplot with a fitted trendline. The trendline suggests that an increase in food supply per day of 2,000 kilocalories per farmer corresponds to an increase in real GDP of roughly 10 trillion constant 2015 US dollars. If all the points fell directly on the trendline, the two variables would have a perfectly predictive relationship. This means if we know the food supply per farmer, we can confidently predict GDP and vice versa.
To see how strong this predictive relationship is, I tested the correlation between the annual change in food supply per farmer per day and the annual change in real GDP. This revealed a moderately strong relationship (coefficient = 0.445) that was super significant (p-value = <0.001), meaning these findings aren’t a coincidence.
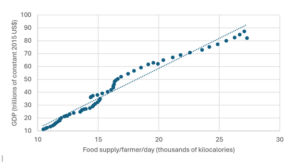
Food supply per farmer per day and real GDP, with a fitted trendline.
This is a surface-level analysis that does not prove that increases in food supply per farmer cause increases in real GDP. Many factors affect both food supply per farmer and GDP. This is a solid first step, however, to testing the central hypothesis of the TTOM: More mouths fed per farmer frees up more hands to engage in other economic activities and to exchange more goods and services in the market. In other words, the real economy grows as well as the monetary sector that reflects it.
[1] ERS’s metric includes producers of some non-food agricultural commodities, such as tobacco.
Alix Underwood is a Research Associate at CASSE.


Jim Hightower, our former Texas state commissioner of agriculture (1983-1991), had a pithy explanation for city folks insufficiently aware of their food sourcing, or more so applicable to city-bred economists who were dismissive of drought effects because farming and ranching were only a small one-digit percent of GNP. (Which was something I heard from an economist testifying at a Texas legislative hearing one day, which caused legislators from rural areas, sitting up at the dais, to roll their eyes and/or voice objection.)
“If you eat, you’re involved in agriculture.”
Nice analysis, and thought provoking. I like that you are doing the right thing, noting that correlation exists, but to be strictly correct, one shouldn’t jump to concluding that there is causation. It can be emotionally difficult to keep that distance, and say “we can’t prove causation at this time” but it’s the scientific thing to do.
I hope we hear more from you!
Thank you, Cole! I agree that it’s of utmost importance to avoid misleading claims about research results. Though researchers have fancy methods for claiming causality with some confidence, strictly speaking it’s impossible to truly prove causation, because we don’t have a counterfactual. We would need a second Earth where every variable is exactly the same except for our independent variable of interest; in this case, food supply per farmer. Only then could we observe its true effect on GDP with all else remaining equal. Alas, no second Earth, so we make do!
Perhaps when Musk gets to Mars our counterfactual will be available.
Alix great work but can you separate out animal agriculture somehow? so much of the energy direct and indirect and freshwater and soils harms are related to the ever increasing animal protein component of diets
Thanks for this input, Mike. This has been at the back of my mind. We’ve discussed using a staple crop variable instead of general food supply, as this might better capture the process of meeting basic needs so that people can dedicate themselves to other economic activities. If we stratified the trophic base of the economy, animal agriculture would be above plant agriculture, because you need lots of crops to grow animals. We also want to study the environmental impacts of each trophic level (or sub-level, if we separated out animal ag). There are so many directions to take this research.