Surprising Assumptions When Estimating the Ecological Footprint
by Peri Dworatzek
Ecological footprint and biocapacity are derived using an accounting framework that quantifies economic activity in relation to the environment. Researchers have described this accounting framework as the supply (biocapacity) and demand (ecological footprint) of the biosphere’s regenerative capacity.
Launch of the 2026 edition of the National Ecological Footprint and Biocapacity Accounts. (Footprint Partnership)
Many people and organizations around the world use these metrics to communicate and measure impacts on the environment. Some governments include ecological footprint and biocapacity data in their climate and biodiversity strategies. Non-profits use this data to communicate environmental impact to the public.
Let’s explore some of the theoretical and methodological assumptions in the ecological footprint and biocapacity accounting framework. As a researcher in the ecological footprint community, I have attempted to characterize these assumptions how the original researchers intended for them to be interpreted. I did not include all perspectives on these assumptions, nor did I include all assumptions and critiques. The goal is to give practitioners and others using the data a greater understanding of how it should be interpreted.
Generating the National Ecological Footprint and Biocapacity Accounts (NEFBA)
Ecological footprint measures the area needed to support the demands of economic activity, and biocapacity measures the area available to support those demands. In a sustainable world, ecological footprint would not exceed biocapacity. However, this is not the case in an economic system plagued by growth obsession. Global ecological footprint has exceeded global biocapacity since the early 1970s, a condition known as ecological overshoot.
Researchers at the Ecological Footprint Initiative at York University and the University of Iceland generate National Ecological Footprint and Biocapacity Accounts (NEFBA) every year. The NEFBA include data reflecting a country’s economic production, trade, and consumption. The Ecological Footprint Initiative is a research and data hub for world-leading experts in ecological footprint and biocapacity accounting. They also apply the NEFBA at other scales—global, regional, and local—and improve upon the methodology.
Researchers at the Ecological Footprint Initiative calculate the NEFBA by stitching together numerous reliable international data sources. The Food and Agriculture Organization of the United Nations’ (UN) FAOSTAT database is an important source of data in the NEFBA. Footprint researchers extract data from FAOSTAT on crop and livestock products, fish capture, forestry products, land use, and land cover. Other data sources include the International Energy Agency for carbon emissions, UN Comtrade for traded goods, and Global Carbon Budget for the quantity of carbon emissions sequestered by the world’s oceans.
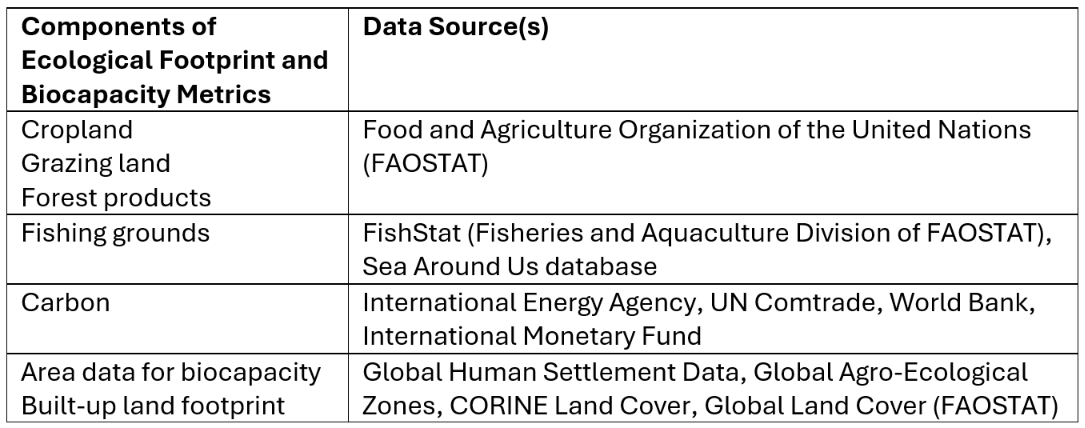
Data sources for the National Ecological Footprint and Biocapacity Accounts.
Over the past 30 years, practitioners and scholars around the world have developed the ecological footprint and biocapacity accounting methodology, and researchers have scientifically verified it in numerous publications. The NEFBA (previously referred to as NFA) were first generated by researchers at the Global Footprint Network (GFN) in the early 2000s.
GFN is a not-for-profit research organization helping society respond to ecological overshoot. In 2018, GFN transferred the NEFBA production to York University’s Ecological Footprint Initiative. Since then, GFN has focused on promotion and application of the data. Their flagship promotional campaign is Earth Overshoot Day.
Researchers at the Ecological Footprint Initiative employ the same rigorous methodology that GFN used. The Ecological Footprint Initiative also leads a multi-stakeholder partnership called the International Ecological Footprint Learning Lab (IEFLL). This lab aims to improve the NEFBA methodology and make the data more accessible to practitioners and the public. IEFLL mobilizes knowledge on their blog and YouTube channel.
From Hectares to Global Hectares
To understand the assumptions made to generate the NEFBA, one must first understand how ecological footprint and biocapacity are quantified. Researchers use a global-average unit of bioproductivity called global hectares. This allows them to compare different land types, times, and regions. How do researchers go from hectares to global hectares?
There are three main parts of the ecological footprint equation: (1) productivity demand, (2) yield factor (YF), and (3) global equivalence factor (EQF). Let’s assume we’re calculating the ecological footprint of a country. The productivity demand is the national harvest of a specific product—or, in the case of the carbon footprint, the carbon emissions—in annual metric tons, divided by the national yield of the same product in annual metric tons/hectare. The yield factor is the national yield divided by the average world yield, both in annual metric tons/hectare. The global EQF is “a productivity-based scaling factor that converts a specific land type (such as cropland or forest) into a universal unit of biologically productive area, a global hectare.”
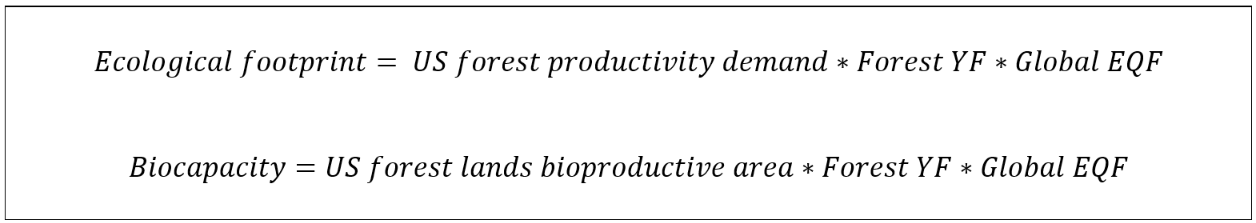
Simplified ecological footprint and biocapacity equations for U.S. forest products. YF = yield factor. EQF = equivalence factor. Forest land biocapacity also accounts for carbon sequestration, which is not captured here.
The biocapacity equation includes (1) bioproductive area, (2) yield factor, and (3) global EQF. The bioproductive area is the national growth (annual metric tons) of a specific resource divided by the national yield (annual metric tons/hectare). The yield factor and global EQF are the same as in the ecological footprint equation. The main difference between these equations is that ecological footprint includes the annual harvest rate and biocapacity includes the annual growth rate. When the harvest yield exceeds the growth yield, that indicates ecological overshoot.
Surprising Assumptions About the Cropland Ecological Footprint
Even after thirty years of refinement, condensing concepts as complex as economic activity and the biosphere’s regenerative capacity into a single metric requires making some assumptions. One conceptual assumption concerns the cropland component. The cropland footprint measures the amount of land demanded to grow crops consumed by humans or used as fibre materials, and some crops consumed by livestock and fish. Cropland biocapacity measures the amount of cropland available to grow these crops. This only includes land already used for crops, not all of the bioproductive land available to convert to cropland.
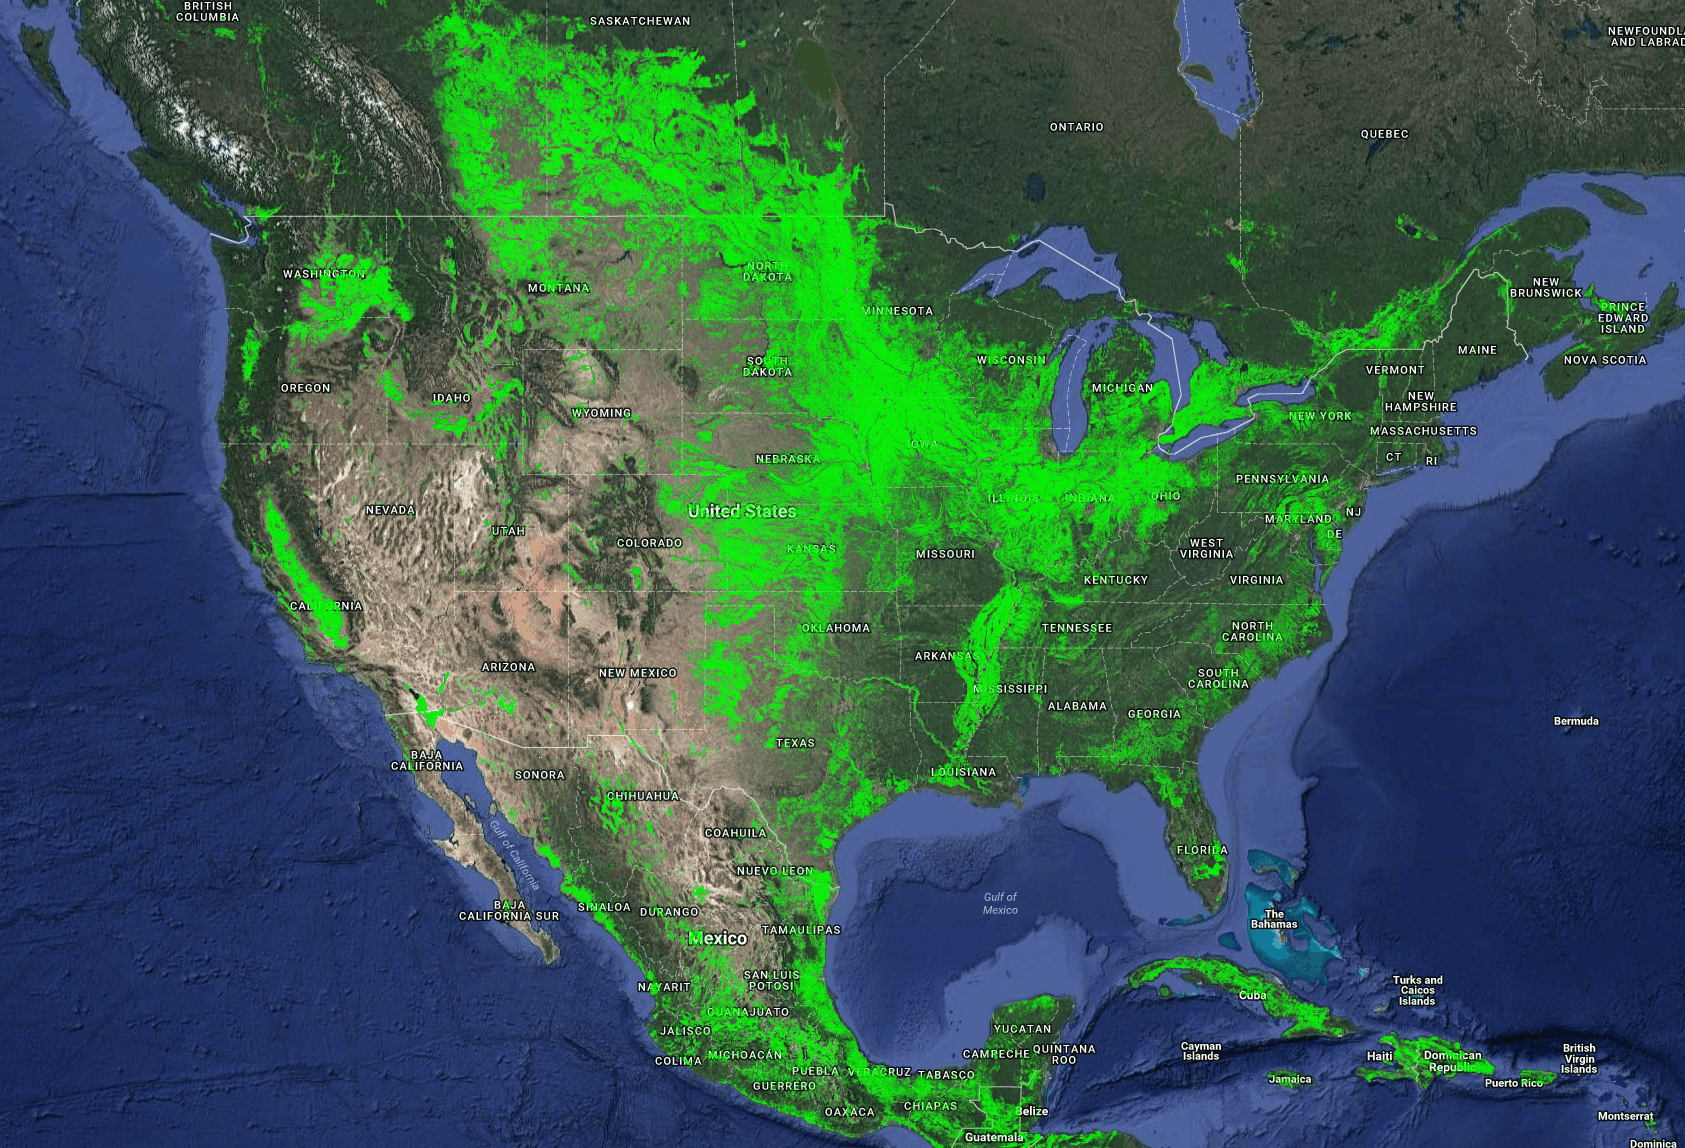
In 2015, the United States contained 166 million hectares of cropland (green). (U.S. Geological Survey)
Because humans manage all growth on cropland as harvests, the harvest yield and growth yield are exactly the same. The assumption, therefore, is that cropland ecological footprint of production cannot exceed cropland biocapacity. In other words, the cropland component cannot enter into ecological overshoot.
Ecological footprint researchers consider this to be a “conservative assumption.” They have used it since William Rees and Mathis Wackernagel developed the concept in the early 1990s. The NEFBA framework accounts for other natural resources that the agricultural industry uses to harvest crops and manufacture crop-derived products. For example, they account for fossil fuels used to power machinery. However, these other resources are included in their respective footprint components—in the case of fossil fuels, the carbon component—rather than in the cropland footprint component.
Some scholars argue that since cropland footprint cannot exceed biocapacity, this implies sustainability. Yet there are many environmental issues with intensive agriculture, such as excess fertilizer use disrupting soil health and polluting water systems. But if synthetic-fertilizer use increases cropland yield, this is registered in the NEFBA as an increase in cropland biocapacity. Some researchers suggest incorporating data on historical cropland yields, comparing them to present yields to account for changes in soil health.
Surprising Assumptions About the Built-Up Land Ecological Footprint
At first glance, built-up land might seem like one of the easier footprint components to understand. It measures the area containing built infrastructure such as housing, roads, and other buildings. However, as you dive into the theoretical and methodological weeds, there are important assumptions and data limitations that complicate calculating this component.
One difficulty is that there is no comprehensive global dataset detailing the relationship between built-up land and traded goods. In other words, we don’t always know the amount of built-up land required to manufacture traded goods. Therefore, the calculation doesn’t include imports or exports, and built-up land ecological footprint of production equals built-up land ecological footprint of consumption. Researchers argue this likely distorts the data, overestimating built-up land footprint for countries that are net-exporters and underestimating it for net-importers. The built-up land footprint of trade can be estimated for specific countries, or at smaller regional scales, depending on data availability.
Another concern is that, like the cropland component, built-up land footprint equals built-up land biocapacity. This is because both values are assumed to capture the “bioproductivity lost to encroachment by physical infrastructure.”
Another key assumption is that the lost bioproductivity per hectare is equal to that of cropland. In other words, infrastructure is assumed to be built on land that had been cropland, although this is not always the case. “In tropical countries, for example, infrastructure often occupies previously forested areas, and in the Middle East and Central Asia, built infrastructure almost certainly occupies formerly arid non-productive land and hence should have no associated biocapacity.”

Is the bioproductivity of Riverdale Park a good representation of the bioproductivity lost to the development of its host city, Toronto? (Dillan Payne, CC BY-SA 2.0)
Researchers hotly debate the best way to resolve this methodological hurdle. Each proposal comes with its own assumptions and complications. Some researchers suggest using geospatial data for more accurate estimates of what land-cover type was replaced by built-up infrastructure. Others suggest using geospatial data to calculate the bioproductivity of greenspaces in built-up areas such as parks and gardens. Researchers at the IEFLL partnership are testing how to use Earth observation data to improve the NEFBA.
Another suggestion is to remove built-up land from the ecological footprint and biocapacity accounting framework. This implies built-up land has zero biological productivity and is not relevant when measuring the demand and supply of bioproductive land.
Underestimating Environmental Impact
Ecological footprint and biocapacity data can be difficult to interpret because of the inherent complexity of distilling a wide array of information into a single metric. It is conceptually difficult to turn global economic activity and bioproductivity into an “ecological overshoot” ratio.

Global ecological footprint compared to global biocapacity, in global hectares, between 1961 and 2025. (data from the National Ecological Footprint and Biocapacity Accounts)
Yet, when we so urgently need to raise awareness about limits to growth, we shouldn’t let perfection get in the way of progress. The ecological overshoot ratio is a strong tool for communicating environmental impacts. Additionally, it has a powerful ability to lead people to draw connections to nature because it is a land-based metric, measured in global hectares.
The key takeaway is that the theoretical and methodological assumptions baked into the accounting framework lend themselves to underestimating environmental impact and overestimating regenerative capacity. Like with most other scientific measurements and conclusions, researchers are being conservative. It’s not as if humanity needed another reason to reduce the global ecological footprint and transform economic systems to a steady state, but just in case: Global ecological footprint might be higher than we expect.
 Peri Dworatzek is a senior research scientist at CASSE and a partnership coordinator at the International Ecological Footprint Learning Lab.


")


Glad to this kind of work making progress! I would like to contribute to the effort as I am able.
Great work. Thanks. The simple footprint number–six earths to support my lifestyle for example–has been a useful way to conceptualize human impact. This will always be more a qualitative estimate than exact. “Human impact too much.” But the real story needs disaggregation. I heard a keynote paper at the 2009 EAERE meeting by Kirk Hamilton of the World Bank on “genuine accounting.” His point was that although GDP statistics looked like some African countries were getting richer, if you accounted for loss of soils, wildlife, and forests and depletion of oil and minerals the countries were getting poorer. Footprint focuses on flows (production and consumption). A more complete view includes changes in stocks–of soils, fish, forests, human capital, physical capital, cumulative carbon, plastics pollution, species numbers, etc. Number recently encountere: 130,000 abandoned oil wells in the U.S.A. Depletion of stocks and of biocapacity matter a lot in the long run. Currently the world is doing so so but the long run trends are worrisome. Soil loss and pollution should definitely be in the analysis. Key ecosystem life support sub-systems (like climate, soils, species diversity) should get reported in a more complex look at footprint v biocapacity. And some context is needed regarding acceptable standards of living. We can reduce footprint by all living like Bangladeshis, but is that acceptable? And rich countries, especially rich people in rich countries, consume far more than needed for human well being. Phil Cafaro’s definition of overpopulation is “damage to other species and life support systems and/or damage to future generations.” (Not his words, but close.) World clearly overpopulated by this definition. Von Liebig’s law of the minimum means that if any essential life support system fails, the whole economy would collapse. So several sub-footprints matter and should get attention.
Hi Max,
You hit the nail on the head. That’s another question our team is researching at the International Ecological Footprint Learning Lab, concerning how to include stocks in the accounting framework. This is also important to quantify minerals that are depleting for tech batteries.
Another great point about using footprint metrics alongside quality of life metrics. That’s one I’m personally interested in exploring more, and is getting easier as countries are prioritizing quality of life data collection – Canada is a great example of this.
How much US cropland is owned by foreign countries like China? I understand that they’re 13 countries with US land ownerships. Most of this produced is being exported?? What benefit is this to the American public?
Water use is a premium, yet these countries are free loading off citizens and state supplies.
Forest lands too? How does this figure into our national and regional efforts to achieve sustainability of our natural resources?
What restrictions if any do we have on these foreign agricultural operations? How does this impact our footprint/biocapacity planning efforts?
Hello CASSE and colleagues,
I fully agree with your post on the Human Footprint underestimation and methods; big thanks.
It’s a vast issue and widely misreported by parsimonious scholars and institutions for a long time,
instead of more holistic approaches; Mother Earth perspectives.
As a matter of fact,
we all saw and promoted that issue for years and just got a paper done on the matter for (terrestrial) Alaska,
as a major holder of wilderness in the US; citation here:
Steiner, M., & Huettmann, F. (2025). Moving beyond the physical impervious surface impact and urban habitat fragmentation of Alaska: quantitative human footprint inference from the first large scale 30 m high-resolution Landscape metrics big data quantification in R and the cloud. PeerJ, 13, e18894.
In the Anthropocene, virtually all processes and patterns are now dominated by (industrial) human society,
I would say. Happy to learn.
Please keep us posted, and THANKS again
Falk Huettmann